Mer gets 43% of the joint company. Eviny gets 57%. That's the deal Statkraft and Eviny Group struck when they agreed to merge their fast charging networks across Norway, Sweden, and Germany. But does the operational data support that split?
We ran both networks through our Pulse methodology — the same framework that combines location quality, operator execution, and market demand into a single comparable score. The result: Mer's network scores roughly 68% of the combined total. Not 43%.
That's a 25 percentage point gap. And it persists across every scenario we tested.
Prefer to watch? Here's the 4-minute version.
What we measured
The Pulse score for each network is built from three components, calculated per country and then summed across all markets:
- Location score — how well-positioned each individual station is, based on traffic patterns, demand density, and accessibility. Summed across all FC stations in the network.
- Execution factor — how effectively the CPO converts location potential into actual utilisation, measured against market averages. Above 1.0 means outperformance.
- Market demand — the total addressable fast charging demand in each country, based on BEV stock, charging frequency, and session volumes.
Because Eviny stopped reporting realtime data in December 2025, we used the four-month window from August to November 2025 — the last period where both operators had full data coverage in the Nordics.
The networks, by the numbers
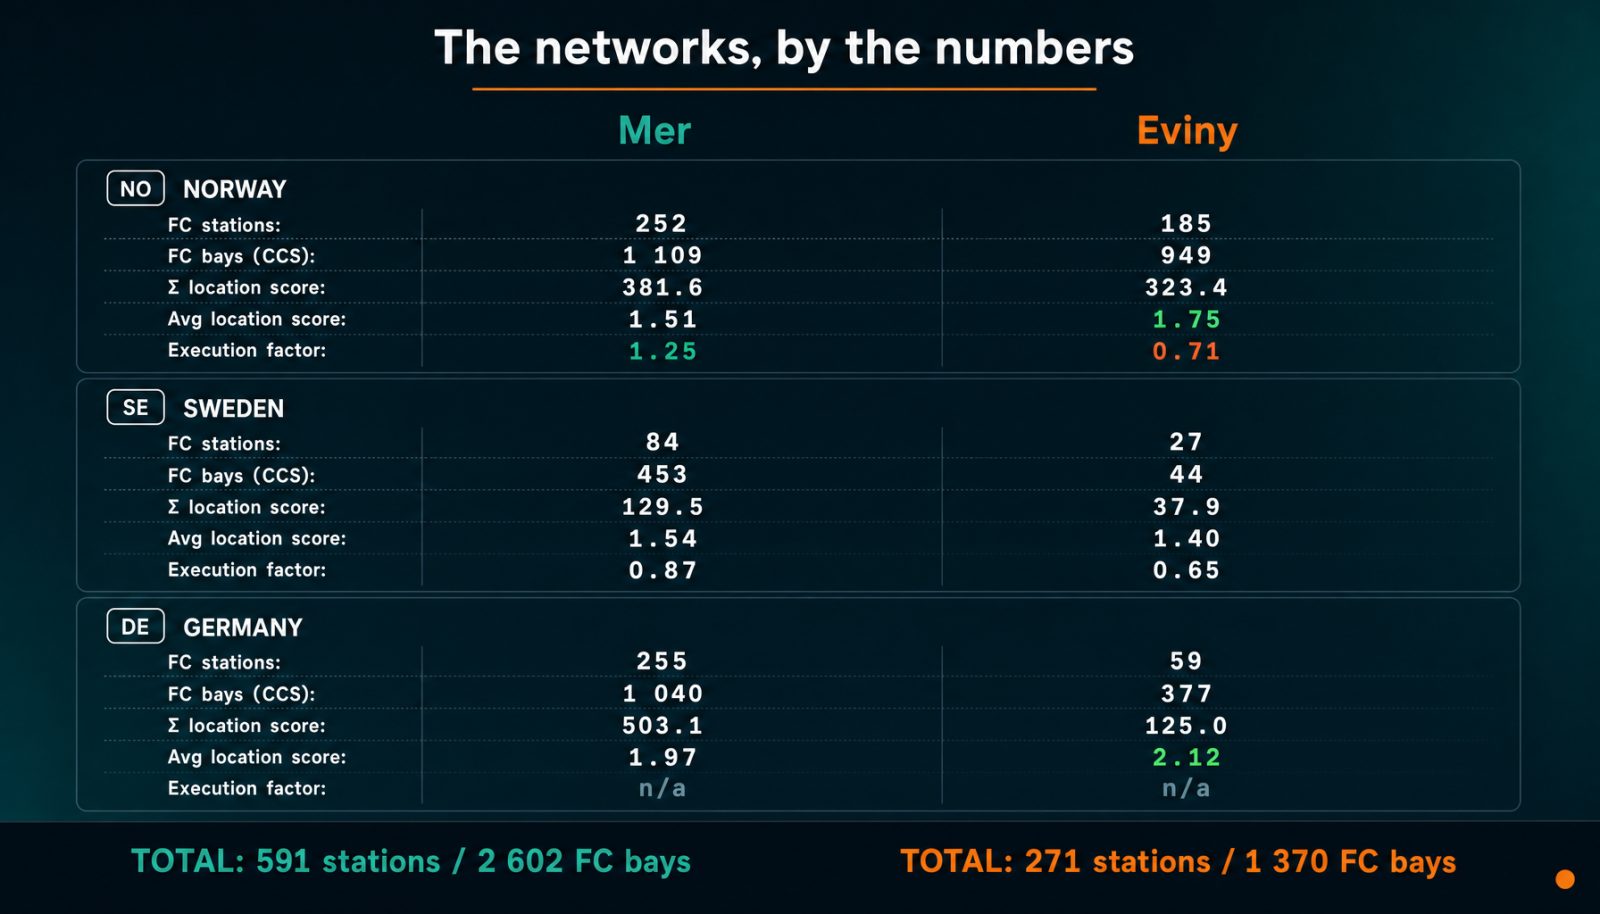
The station counts alone tell a story. Mer operates 591 FC stations with active realtime reporting across the three markets; Eviny has 271. Mer runs 2 602 CCS bays to Eviny's 1 370. In Germany — the largest EV market in Europe by BEV stock — Mer outnumbers Eviny more than four to one.
But size isn't everything. Eviny's Norwegian stations have a notably higher average location score (1.75 vs 1.51), suggesting they chose their spots well. The problem is execution: Eviny's average execution factor in Norway during this period was 0.71 — meaning its stations captured only 71% of the utilisation you'd expect given their locations. Mer's Norwegian network hit 1.25, converting 25% more demand than the model predicted.
The Pulse score result
Multiplying location quality by execution and weighting by market demand gives us a total Pulse score for each operator across all three countries.
Country breakdown
Norway dominates the calculation, accounting for 60% of the combined Pulse score. But even isolating individual countries, Mer leads everywhere: 63.9% in Norway, 69.3% in Sweden, 80.1% in Germany.
The execution gap is the story
Network size and location do most of the work: on location scores alone, Mer already holds 63.1% (see the scenarios below). Execution and demand weighting add roughly the last five points of the 25-point gap. Mer consistently operated above the market average (1.0) in Norway throughout the Aug-Nov period, peaking at 1.34 in October. Eviny peaked at 0.80 in Norway in August and ended at 0.66 in November, with only a partial recovery to 0.73 in October.
In Sweden, both operators showed more volatility — expected given the smaller networks. Mer Sweden reported no data at all in September 2025, a data blip visible as the gap in the chart. Excluding that month, Mer Sweden averaged 1.01 across Aug, Oct, and Nov. Eviny Sweden peaked at 0.76 in September.
Seven scenarios, same conclusion
To stress-test the result, we ran seven different scenarios — varying which countries are included, how location scores are weighted, and whether the low-confidence early Swedish data is excluded.
| Scenario | Mer | Eviny |
|---|---|---|
| Base case (all countries, Aug-Nov) | 68.0% | 32.0% |
| Nordic only (NO + SE) | 65.4% | 34.6% |
| Norway only | 63.9% | 36.1% |
| Sep-Nov for SE (drop low-confidence Aug) | 67.1% | 32.9% |
| Location scores only (no execution or demand) | 63.1% | 36.9% |
| EVSE-weighted location scores | 62.3% | 37.7% |
| Equal country weighting | 70.7% | 29.3% |
The most generous scenario for Eviny — weighting location scores by the number of EVSEs at each station — still puts Mer at 62.3%. The least generous — equal country weighting — gives Mer 70.7%. The deal split of 43/57 falls outside every scenario we could construct.
Backtesting against actual charging minutes
Scoring models are only useful if they track reality. So we compared the Pulse score split to actual fast charging minutes recorded during the same Aug-Nov 2025 period. At the time, Germany had no realtime minute-level data, but Norway and Sweden did — and those two markets account for 82% of the combined Pulse score.
| Market | Pulse prediction | Actual minutes | Delta |
|---|---|---|---|
| Norway | Mer 63.9% | Mer 65.1% | +1.2pp |
| Sweden | Mer 69.3% | Mer 83.6% | +14.2pp |
| Nordic combined | Mer 65.4% | Mer 65.9% | +0.6pp |
The Nordic combined result is off by 0.6 percentage points. In Norway — the dominant market with the deepest data — the gap narrows to 1.2 points. The Pulse methodology tracks actual utilisation almost exactly where the data is most reliable.
Sweden shows a wider gap between Pulse prediction and actual minutes, and the data blip does not explain it: Mer Sweden reported zero minutes in September 2025, which can only pull its actual share down, yet actual minutes still came in above the prediction. Small Swedish sample sizes make the comparison noisy. Norway, where both networks have deep and consistent data, is the more meaningful comparison.
The backtest result matters for two reasons. First, it validates that the Pulse components — location quality, execution, and demand — combine into a score that reflects actual market outcomes. Second, it gives us confidence in the German estimates, where we could not directly measure utilisation at the time. With our realtime coverage now extending to Germany and other European markets, future M&A analyses will include execution data across all three countries.
So why didn't the deal reflect the data?
The Pulse score measures operational value — location quality, execution, demand. But merger valuations price in factors the Pulse doesn't capture. Several of those factors could favour Eviny.
- Contract length. If Eviny holds longer location agreements on better terms than Mer, the net present value of those contracts lifts the portfolio regardless of current utilisation. Location scores tell you where a station is; contract terms tell you how long you get to keep it there. In a market where prime roadside locations are increasingly contested, tenure is value.
- Strategic dynamics. Statkraft has publicly signalled for years that it wants to offload Mer, without finding a buyer. It has also stated it does not want to be the majority owner of its charging venture going forward. Add to that the public scrutiny Statkraft has faced for loss-making non-core ventures — EV charging and biofuel chief among them — and you get a negotiating dynamic that does not favour the seller. Accepting a 43% stake also avoids having to publish a revised standalone valuation of Mer that might have crystallised a loss. At least in the short term.
- Cost base and EBITDA margin. Eviny is known in the industry for running lean — minimal backend complexity, a relatively simple app, a no-nonsense approach to CPMS and organisation. Mer operates with in-house backend systems and a larger corporate structure. If Eviny delivers comparable or better EBITDA margins on lower revenue, that operational efficiency gets priced into the deal.
What it means
The 25 percentage point gap between Pulse value and deal value tells us something important: in EV charging M&A, operational excellence is not yet the primary valuation driver. Asset quality, contract terms, cost structure, and negotiating leverage still dominate. As the market matures and margins tighten, that will change. The CPOs that execute well will eventually be valued accordingly.
Statkraft is now a minority owner of a joint company for which it remains highly exposed financially. That creates an interesting tension. Will the merged entity leverage the objectively and measurably stronger Mer brand to extract added value from its combined location portfolio? Or will its new majority owner fold Mer into the leaner and more cost-efficient Eviny brand?
Time will tell. The data will tell us first.
Corrected 6 October 2026: location scores alone already give Mer 63.1%, so execution and demand weighting add about five of the 25 points rather than explaining most of the gap, and the Sweden backtest explanation now runs the right way.