
That is the August story in one sentence. The rest of this piece is the measurement behind it. This time we looked at a slightly different sample: the typical holiday destinations, France and Italy, alongside a typical holiday-goer, the Netherlands, with Switzerland and the three Nordic markets carried over from July. 12 379 stations and 59 069 DC bays, the same stations in both months, so the numbers only move when drivers do.
Prefer to watch? Here's the 4-minute version.
One big Saturday, then a long fade
Percent load on a fixed panel of 25 991 DC bays, by day, 20 July to 31 August 2026
Load = charging minutes ÷ (bays × minutes in the day). Same bays every day. Source: Chargalytics.
The daily chart uses only bays observed every single day of both months. The monthly comparisons use stations seen at least 24 days in July and 28 in August, weekday-balanced, with a four-day feed outage on 14–17 July left out.
The French line on the chart is a mountain with one side. Two Saturdays above 24% in late July, then 26.8% on 1 August, 26.2% on the 8th, and after that every Saturday lower than the last. There is no matching bump at the end of the month, which is awkward for anyone who sized a site for the Sunday-night rush home. People leave together and drift back. The departure is a spike. The return is a rumour.
Italy runs a week behind, peaking on 8 August at 25.0%. Then Ferragosto, the national day of not driving anywhere. The Saturday of the long weekend came in at 14.6%, lower than any Saturday in July. The chargers had the day off too.
The Nordic lines tell the other half. Sweden's Saturdays step down from 19.9% in mid-July to 11.9% by the end of August with barely a wobble on the way, and Norway is the same shape. There is no August peak up there. There is July, and then there is the drive home, and the drive home is a slope, not a cliff.
| Saturday | France | Italy | Netherlands | Norway | Sweden |
|---|---|---|---|---|---|
| 18 Jul | 24.6 | 22.3 | 14.7 | 18.8 | 19.9 |
| 25 Jul | 25.4 | 19.7 | 14.6 | 18.3 | 18.9 |
| 1 Aug | 26.8 | 24.2 | 14.1 | 16.7 | 17.4 |
| 8 Aug | 26.2 | 25.0 | 14.2 | 15.0 | 15.0 |
| 15 Aug — Ferragosto | 22.8 | 14.6 | 13.4 | 12.5 | 12.2 |
| 22 Aug | 20.6 | 17.2 | 14.0 | 12.5 | 11.6 |
| 29 Aug | 17.3 | 15.6 | 14.5 | 11.7 | 11.9 |
Every market has a rush hour. It's not the same hour.
Zoom in from the day to the hour and the holiday turns out to have a timetable. France, Italy and Switzerland all peak at ten on Saturday morning. Not Friday evening, not Sunday afternoon: Saturday, mid-morning. The reason is the rental calendar. French and Italian holiday lets run Saturday to Saturday, so the whole country checks out and checks in on the same day, and the first charging stop is 200 km from home at about the time the kids ask for lunch. The French fast-charging network ran at 22.6% at ten on a Saturday against 7.9% in an average midweek hour. One Saturday morning in France is worth three Tuesdays.
Percent load by hour of the week in August 2026, all DC sites, local time
Bay-weighted, all DC sites with 50 kW or more, four fixed weeks in August. Source: Chargalytics.
The Nordics keep different hours because they are doing something different. Nobody rents a Swedish cabin Saturday to Saturday; you own it, or your parents do, and you go when work lets you. So Norway peaks on Friday at noon, the drive out, and Sweden and Finland on Sunday at eleven, the drive home. Three markets, three rush hours, one shared habit: nobody goes anywhere on a Saturday afternoon. Two holiday cultures, two traffic patterns, and a site on the E6 and a site on the A7 need to be built for different weeks. In July the Nordic peaks were in the same places, only taller. Norway’s busiest hour was 27.9% then and 20.1% now, and it moved from Saturday to Friday, which is what a market looks like when the tourists leave and the locals get their weekends back.
| Market | Peak day | Premium over Tue–Thu | Peak hour (local) |
|---|---|---|---|
| France | Saturday | +42% | Sat 10:00 |
| Italy | Saturday | +39% | Sat 10:00 |
| Finland | Sunday | +29% | Sun 11:00 |
| Sweden | Sunday | +27% | Sun 11:00 |
| Norway | Friday | +18% | Fri 12:00 |
| Switzerland | Saturday | +18% | Sat 10:00 |
| Netherlands | Friday | +7% | Fri 11:00 |
And then the Netherlands, whose busiest hour is eleven on a Friday morning and whose Friday as a whole is just 7% busier than its Tuesday-to-Thursday average. That is not a holiday pattern. It is a working week with a long lunch. Hold that thought for two sections.
The north gave it back
| Market | Stations | Bays | July | August | Change |
|---|---|---|---|---|---|
| Italy | 2 632 | 8 005 | 10.6% | 10.2% | −3.0% |
| Switzerland | 1 559 | 3 456 | 7.2% | 6.7% | −6.9% |
| France | 3 712 | 19 947 | 12.3% | 10.8% | −12.3% |
| Netherlands | 752 | 3 873 | 12.0% | 10.5% | −12.6% |
| Norway | 1 280 | 10 402 | 12.2% | 9.7% | −20.8% |
| Finland | 1 030 | 5 046 | 10.1% | 7.8% | −22.6% |
| Sweden | 1 414 | 8 340 | 11.7% | 8.5% | −26.9% |
A fifth to a quarter of July's load, gone in a month. Sweden lost the most at 26.9%, with Finland and Norway not far behind. The markets that carried the summer surge are the ones that unwound it, which is the least surprising sentence in this article and still the one that matters for a business case. Italy and Switzerland barely moved, having had no surge to unwind. France sits in between, down 12% to 10.8%, which sounds like a comedown until you remember it ran 7.7% in May.
Where on the map it moved
Change in percent load from July to August, most remote fifth of stations versus most urban fifth
Stations split into fifths by Chargalytics location score within each market. Weekday-balanced monthly load, 14–17 July excluded. Source: Chargalytics.
Look at where in each country the load left from, and the story sharpens. In Sweden the most remote fifth of stations lost 41.5% of their July load; the most urban fifth lost 17.1%. Norway and Finland split the same way, with remote sites losing four to five times as much as urban ones. The July surge lived on the roads between towns, on corridor sites that exist for exactly this fortnight, and that is precisely where it left from. The city chargers barely noticed.
Italy is the mirror image. Its remote fifth was the only group in the whole panel that got busier in August, up 3.4%, while its cities emptied. That is what a country on holiday looks like from a charger's point of view: nobody in Milan, everybody on the coast road. France and the Netherlands lean the same way, more gently. Switzerland fell evenly everywhere, which is what a market with no summer peak looks like. Nothing to unwind, so nothing unwinds.
Every dot below is a station in the panel. Zoom into the E6 north of Trondheim, or the A7 south of Lyon, and you can watch the summer leave.
The queue at Urvillers
Relais Urvillers is a four-bay TotalEnergies aire on the A26 between Saint-Quentin and Laon, which is the road Dutch, Belgian and British holiday traffic takes south. In August its weekly pattern touched 90% on Saturday, 89% on Sunday and 87% on Friday, and it spent twenty separate hours of the average week above 80%. Below 80% drivers sometimes wait. Above it they wait every time. Four bays, 150 kW, and a queue with a timetable. This is what a saturated site looks like from the inside.
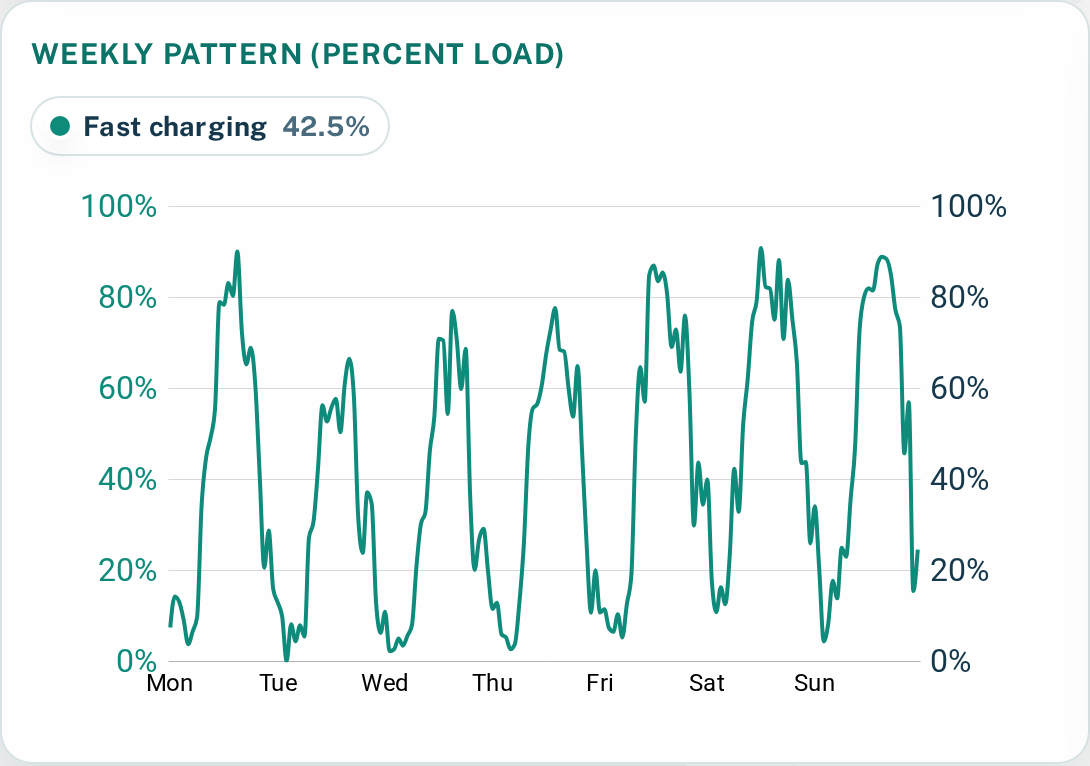
It has company, though less than in July. Of the 8 977 stations in this sample with four or more bays, 60 spent their busiest hour of the week above 80% in August. In July, on the same seven markets, it was 180 of 8 412. As a share of sites that is 2.1% in July and 0.7% in August, and the July piece found 2.2% on its own five-country panel, so the two months line up and August is a third of the peak. Fifteen of the sixteen worst sites are French, mostly TotalEnergies relais on the A6, A26 and A75, with Allego’s Carrefour forecourts on the Riviera and two Tesla sites behind them. Norway, which had 21 sites over the line in July, has none. Widen the net to 60%, pressure rather than queues, and it is 682 sites against 999, or 7.6% of the sample against 11.9%. The pinch points did not disappear. They shrank onto French motorways on French Saturdays.
The Dutch went on holiday too. Just not in the Netherlands.
The Netherlands is the flat line on the first chart, and it is not because the Dutch stayed home. Statistics Netherlands counted 21.9 million Dutch summer holidays in 2025: 13 million of them abroad, 13.4 million by car, and France the top foreign destination at 2.2 million. The Dutch departure shows up at Urvillers on the A26 and on the A7 south of Lyon, not on the A2 south of Utrecht. What stays behind is a retail and commuter network, Fastned hubs and supermarket forecourts, where the cars keep coming whether or not it is August: Friday its busiest day at 15.4%, Sunday its quietest at 13.2%, eight to ten sessions a bay a day all month, and a busiest hour on Friday morning. The Netherlands is an origin market. Origin markets do not peak; destination markets do. Which is, not coincidentally, why it has the least expensive hardware waiting for cars.What to do with this
July’s conclusion survives August: this is a location problem, not a network problem. National load never went near a ceiling. Sixty sites did, on a handful of days, and Urvillers did it every weekend. Portfolio averages hide that, which is the point of looking at the hour-of-week curve rather than the monthly number.
It also splits the audience, the way it did in July. Anyone sizing for average load, which is every for-profit operator with a spreadsheet, sees August as two good Saturdays on a quiet month: France’s national load on 1 August was 2.2 times its level on the 31st. Anyone sizing for the peak, which is whoever has promised a driver a plug at ten on a Saturday, sees a four-bay aire that needs to be eight. Same data, two correct answers, and the gap between them is the cost of a queue.
In the Nordics the question is different. A corridor site that ran at 40% on a July Saturday spent August at 8 to 10% and May at 5 to 9%. That is the number the average-load spreadsheet has to clear, and it has eleven months to do it. July is the bonus, not the plan.
And for anyone hoping the summer was a one-off that can be waited out: France in August was still about 40% above its May baseline, Switzerland 31.6%, Finland 26.3%. The tide went out. It did not go back to where it started, and next July it comes in higher.