Europe's fast-charging network doesn't have a capacity problem. It has about four weeks a year when it does.
Between 6 July and 2 August, load across almost 21 000 DC bays in Norway, Sweden, Finland, France and Switzerland ran 53% above spring. That's the number everyone will quote. The better story is where it landed — on the chargers that spend the other eleven months half empty.
How extreme was July?
It's a blunt measure and an honest one: the share of available bay-minutes that actually delivered energy. In May the panel sat at 10.8%. Between 6 July and 2 August it hit 16.5%.
On paper, none of these markets is anywhere near capacity. For four weeks, all of them behaved as though they were.
Switzerland is the outlier, as it should be. Swiss holidays stagger by canton, and much of the July traffic is passing through rather than setting off — the country is a corridor, not an origin. Finland only looks tame because its June was already inflated by juhannus. Against May it gained 44%, right alongside its neighbours.And Germany?
Five countries carry the main panel because those are the five we have been watching continuously since 1 May. The rest of Europe came onto our feeds during spring, so a May baseline there would measure our onboarding rather than anyone's driving.
Shorten the window to June against July and the panel roughly doubles, to about 40 000 bays — Germany included.
Germany's July was real but modest — roughly half the swing of Sweden, Norway or France, and off a much higher everyday base. German school holidays roll through the Länder from late June to mid-September, smearing the peak across a whole quarter instead of concentrating it into three weeks. A staggered calendar is, it turns out, an infrastructure strategy.
| Country | June | 6 Jul – 2 Aug | Change | Bays |
|---|---|---|---|---|
| Sweden | 11.0% | 15.9% | +45% | 4 584 |
| France | 12.7% | 18.2% | +43% | 10 428 |
| Norway | 11.3% | 15.8% | +39% | 5 567 |
| Germany | 17.6% | 21.5% | +22% | 11 755 |
| Switzerland | 7.5% | 8.8% | +17% | 2 161 |
| Finland | 13.5% | 13.9% | +3% | 3 009 |
Spain, Italy and Portugal get the same treatment in September, once their August is over. That's where the other half of this story lives.
One continent, three holiday calendars
Northern Europe takes July. The south waits for August. The weekly data is not subtle about it.
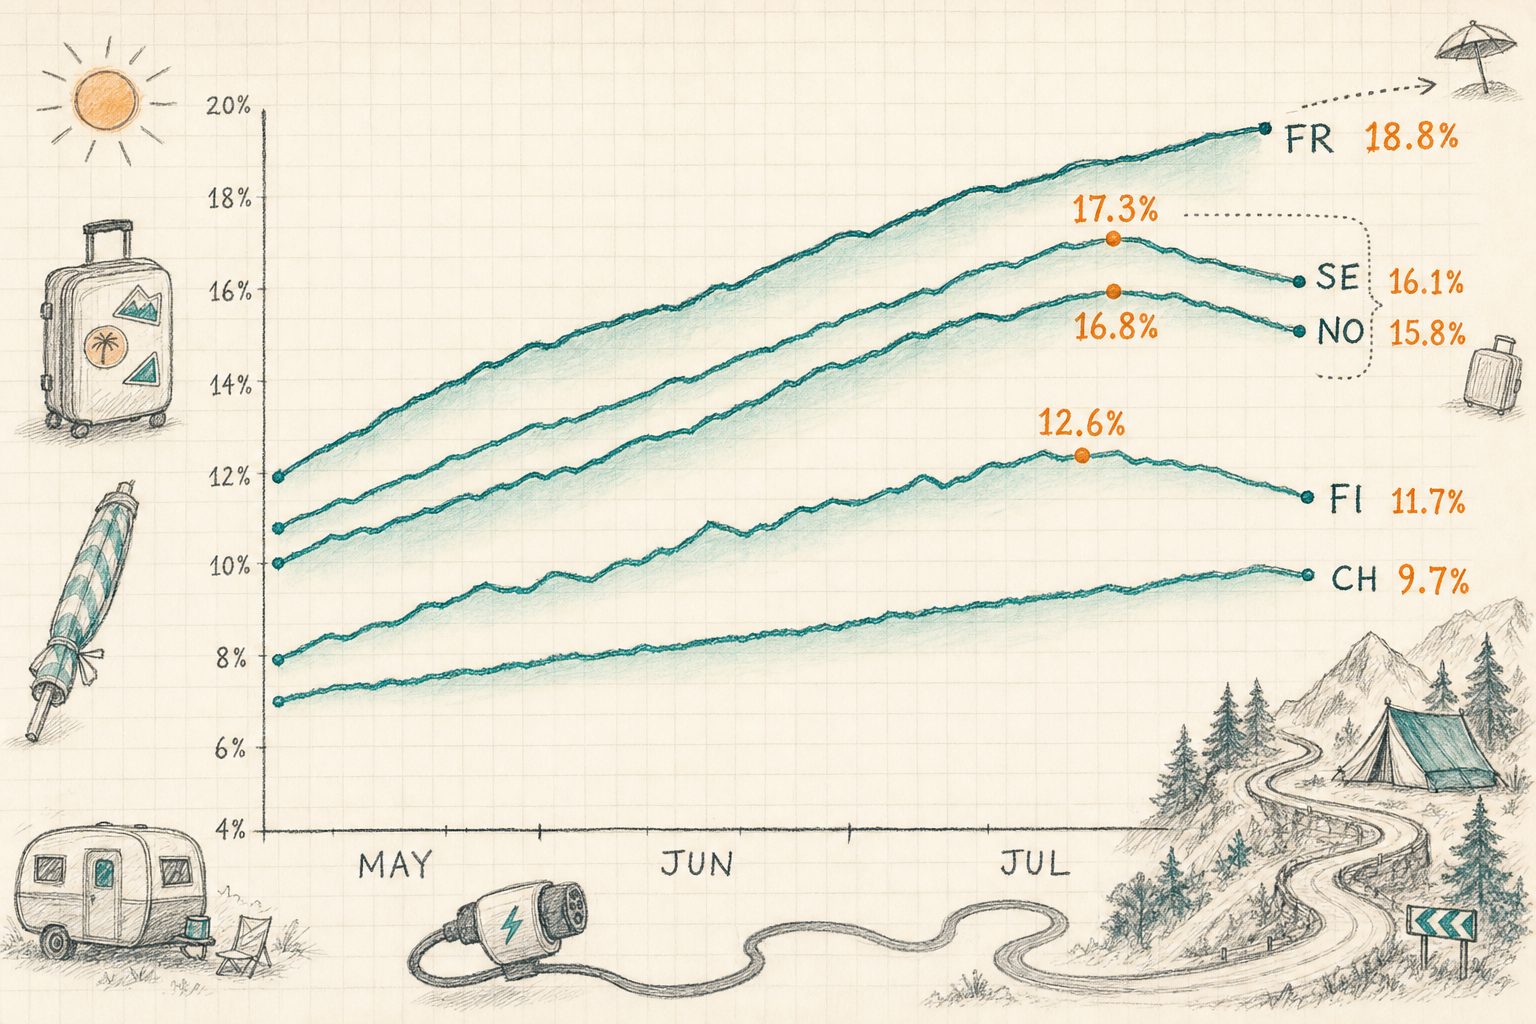
Finland peaked earliest and faded fastest, consistent with a season that front-loads into late June. Switzerland produced the flattest curve of the five — a gentle climb from 6.5% to a plateau around 9.6%, with no dominant week.
Week by week, the same data in full:
July flattens the map
The intuition is that holiday traffic rewards stations on motorways, out of town, near food. Half of that is right.
We took 2 968 stations with clean spring and summer data and joined them to the location model that powers every station page — POI density, competitor proximity, road traffic. Then we lined them up from the middle of nowhere to the middle of town, and asked how busy each group was in spring, and in July.
Left to right: teal is spring, amber is July, and the figure above each amber bar is what that group gained. The isolated stations started furthest behind — 9.5% average load against 12.6% for city-centre sites — and finished level with them. Every group ended July between 14.5% and 16.0%.
That's the finding in one line: July doesn't lift the busy places, it lifts the empty ones until the map is flat. The most isolated fifth gained a median 66%. The most built-up fifth gained 22%. Same countries, same weeks, three times the uplift.
Competitor density says the same thing from the other direction. Stations with two or fewer rival DC sites within 5 km gained a median 65%. Stations with 24 or more gained 13%. Isolation was the single best predictor of a good July.
Food wasn't. Distance to the nearest restaurant or café has essentially zero correlation with July uplift, and the median across all five food-proximity quintiles sits in a narrow band between 37% and 43%. Amenities matter for dwell time and repeat business. They did not decide who won the summer.
One nuance worth flagging: road-traffic score correlates negatively, if weakly, with July uplift. High-traffic locations skew towards urban arterials, and urban arterials had a quiet July. Holiday demand doesn't follow traffic volume. It follows the direction of travel.
Yes, there were queues
We ran that four-week pattern for May and again for July across 6 484 matched multi-bay DC sites. In May, 20 of them peaked above 80%. In July, 145 did. Sites peaking above 60% went from 219 to 904.
| May 2026 | 6 Jul – 2 Aug | Change | |
|---|---|---|---|
| Sites peaking ≥ 80% | 20 | 145 | 7.3× |
| Sites peaking ≥ 60% | 219 | 904 | 4.1× |
| Share of sites ≥ 80% | 0.3% | 2.2% | +1.9pp |
Mapped, the pressure has a shape. Below is every fast-charging station in the eleven countries where June and July compare cleanly — 17 909 of them — coloured by how much each one's load changed. Warm means busier, teal means quieter, and the dot is sized by bays. Pan and zoom: every dot is a station.
77.4% of stations were busier in July than in June, and the warm colour is not evenly spread. It concentrates along the Norwegian mountain and fjord routes — the Gudbrandsdalen corridor and the Hardangervidda crossings more than doubled — the Swedish west coast running up to the Norwegian border, the French Atlantic, Cévennes and Mediterranean routes, and the Alpine passes.
The teal tells the other half. The coldest area on the map is the ring east of Oslo, where 380 bays went backwards by 11%. Then Stockholm, at −6% and −10% across its two densest areas, and Helsinki, where 709 bays fell 9%. Every one of them is a capital. The cities did not get busier in July. They emptied.
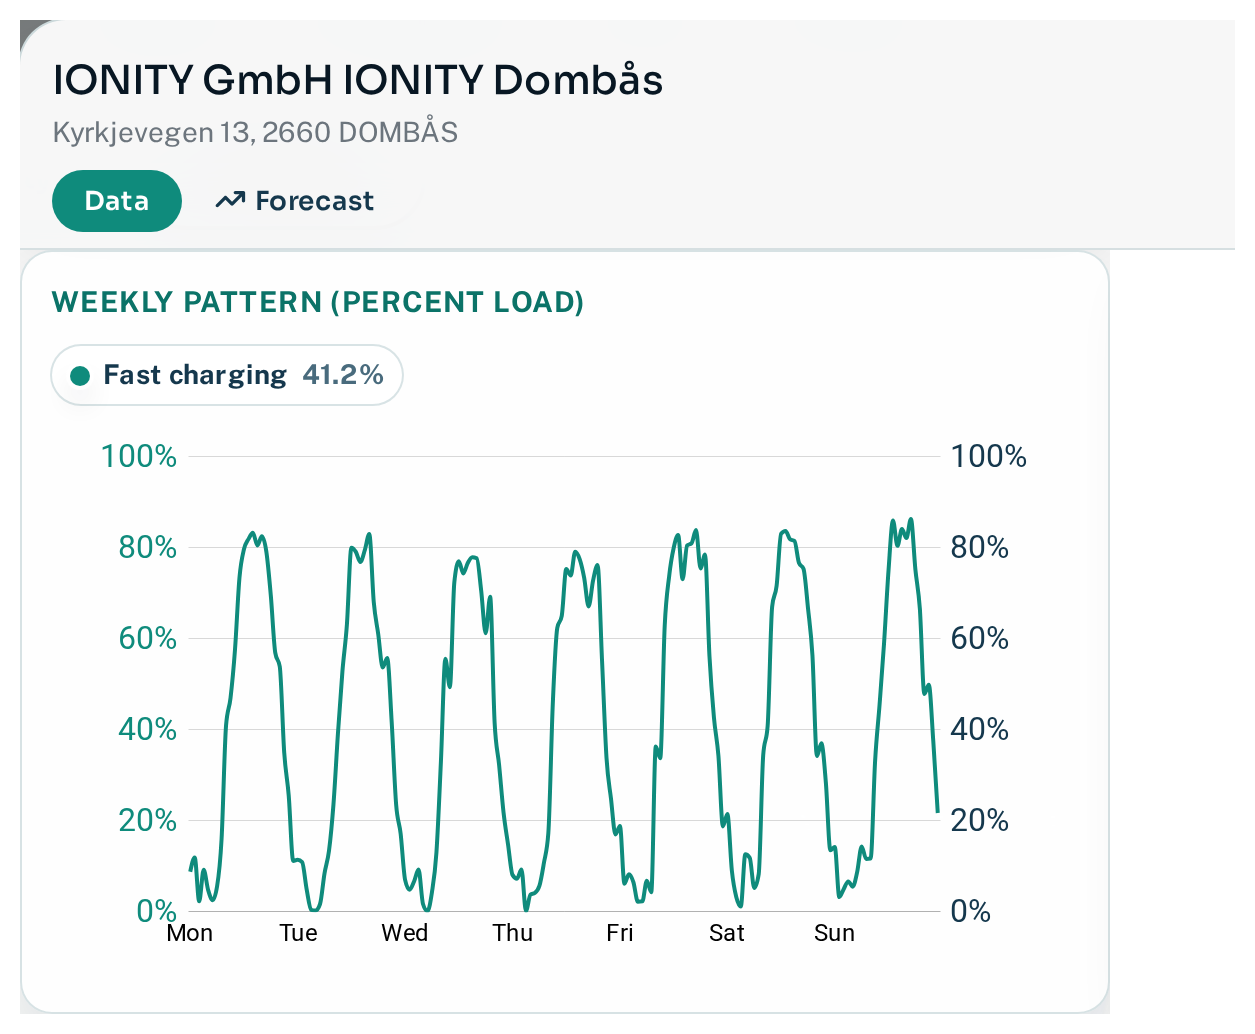
IONITY's site at Dombås, on the E6 through the Norwegian mountains, is what a saturated summer looks like in one picture. Six bays at 350 kW, and a weekly curve that touches 80–86% on every day of the week, not just at weekends.
| Station | Operator | Bays | May peak | July peak | Hours ≥ 80% |
|---|---|---|---|---|---|
| Tanum (SE) | Tesla | 14 | 75.3% | 92.4% | 35 |
| Aire de Dracé (FR) | Fastned | 8 | 60.2% | 94.1% | 24 |
| Uddevalla Herrestads Torp (SE) | Tesla | 8 | 75.1% | 90.1% | 24 |
| Relais de la Ferté (FR) | TotalEnergies | 8 | 68.0% | 92.2% | 21 |
| Aire d'Ambrussum Nord (FR) | Fastned | 8 | 78.6% | 92.8% | 19 |
| Aire de Villers-Bretonneux (FR) | Fastned | 7 | 68.7% | 94.1% | 18 |
| Roissy-en-France CDG (FR) | Electra | 11 | 76.8% | 88.3% | 18 |
| Strömstad (SE) | Tesla | 20 | 82.1% | 88.0% | 17 |
| IONITY Dombås (NO) | IONITY | 6 | 67.7% | 84.9% | 11 |
Winners and losers
Relative uplift across the Nordic panel splits the market cleanly in two.
Networks on holiday routes ran away with it. EDRI, IONITY, Tesla and Kople each added between 68% and 81% to their spring load. Networks built around towns, forecourts and retail barely moved: Uno-X Mobility gained 11%, Vattenfall InCharge 22%, Mer Norway 31%, OKQ8 32%.
There are two very different ways to win a July, and the chart above can't tell them apart.
IONITY and Tesla won it on purpose. Both built along the corridors that carry holiday traffic, and both went into July already busy — spring load of 11.6% and 13.0% respectively. Their summer is the payoff on a deliberate route strategy.
Kople's +68% is a different animal. Its network sits in thinly populated parts of Norway that generate very little everyday demand, and its spring load of 7.2% was among the lowest of any major Nordic network. When the cities empty out and the traffic comes to it, the relative jump is enormous, because the base it is jumping from is so small. Kople isn't so much well placed for the holidays as poorly placed for the other eleven months — and July is the one time that stops being a problem.
The distinction matters commercially. A high base and a high multiple means you have found demand. A low base and a high multiple means you have found seasonality.
In absolute terms it isn't close. Tesla added roughly 157 000 charging hours across its Nordic fleet in four weeks, nearly three times the next network. Scale plus corridor exposure is a powerful combination in July.
| Operator (NO+SE) | Bays | Spring load | July load | Relative | Added hours |
|---|---|---|---|---|---|
| Tesla | 2 439 | 13.0% | 22.6% | +74% | 157 184 |
| Circle K | 2 009 | 12.2% | 16.2% | +33% | 53 841 |
| IONITY | 596 | 11.6% | 20.6% | +77% | 35 771 |
| Mer Norway | 1 402 | 8.6% | 11.2% | +31% | 24 869 |
| OKQ8 | 761 | 10.4% | 13.6% | +32% | 16 744 |
| Kople | 321 | 7.2% | 12.1% | +68% | 10 628 |
| Uno-X Mobility | 412 | 10.4% | 11.6% | +11% | 3 279 |
France repeats the pattern with different names. Atlante gained 69%, SPIE CityNetworks 61%, bp pulse 59%, Tesla 50%, TotalEnergies Marketing France 43%. At the bottom of the table: Lidl France, up 31%. A network attached to supermarkets is a network attached to the people who stayed home.
| Operator (FR) | Bays | Spring load | July load | Relative |
|---|---|---|---|---|
| Atlante France | 302 | 11.1% | 18.8% | +69% |
| SPIE CityNetworks | 243 | 8.9% | 14.4% | +61% |
| bp pulse | 417 | 4.0% | 6.3% | +59% |
| Tesla | 3 293 | 15.0% | 22.5% | +50% |
| Greenflux | 435 | 9.6% | 14.0% | +46% |
| ENGIE Vianeo | 153 | 12.5% | 18.2% | +46% |
| TotalEnergies Marketing France | 1 355 | 14.7% | 21.0% | +43% |
| Power Dot France | 1 053 | 8.4% | 11.7% | +39% |
| DRIVECO | 372 | 7.1% | 9.8% | +38% |
| Lidl France | 790 | 10.2% | 13.4% | +31% |
What this actually means
- The summer peak is a location problem, not a network problem. National average load never came close to a capacity ceiling. 145 individual sites did.
- Portfolio averages hide the pain. A CPO reporting 16% July utilisation can still be turning drivers away at a dozen sites while idling at two hundred.
- A high multiple is a question, not an answer. It can mean corridor exposure. It can also mean a network badly placed for everyday use, which flatters its summer arithmetic. Check the spring number before you celebrate.
- Amenity strategy and corridor strategy are different businesses. Food proximity did nothing for July uplift. Distance from the nearest competitor did almost everything.
- For anyone underwriting sites: the July-to-May multiple is a cheap, honest proxy for how seasonal a station's demand is. Two stations with identical annual utilisation and different summer multiples are not the same asset.
Source. Chargalytics unified observation data — NOBIL feeds for Norway, Sweden and Finland, OCPI-derived feeds for France, Switzerland, Germany and the other mapped markets. All figures cover DC connectors (CCS/Combo and CHAdeMO) rated 50 kW or above.
Period. 1 May – 2 August 2026. Weekly pattern comparisons use four full weeks in each period: 4–31 May and 6 July – 2 August, computed in local time on both sides.
Samples. 20 955 bays for the five-country load panel; 39 249 bays for the June-to-July panel including Germany; 2 968 stations for the location analysis; 6 484 multi-bay sites for the saturation comparison; 17 909 stations across 11 countries on the map; 9 239 Nordic bays and 8 200 French bays for the operator tables. Operator tables show networks with at least 100 bays in the fixed panel.
Added hours = (July daily charging hours per bay − spring daily charging hours per bay) × 28 days × fleet size. It is extra energy-delivering time, not a revenue figure.
Caveats. Percent load counts charging time, not delivered energy: a 50 kW bay and a 350 kW bay count the same. A source-feed outage on 14–17 July is excluded for the non-Nordic markets, and the week of 13–19 July is bridged rather than reported for France, Switzerland and Finland; no peak quoted here falls in that week. The British and Spanish feeds were still maturing through spring, so read those two map figures as directional. Data ends 2 August, before the southern European August peak.