
In 1900 American factories built 4 192 motor cars. More of them ran on batteries than on petrol: 1 575 electric against 936 petrol, with steam making up the rest. By value, electric cars were almost three-fifths of the whole industry.
Then the electric car spent the best part of a century as a museum piece, a milk float and a punchline, before coming back as the thing every carmaker now says it always believed in.
This is the short version of that journey, and we’re telling it for a reason. Last week we quietly opened Chargalytics, free, to researchers, NGOs and journalists anywhere in the world. Consider this our thank-you to the people who kept electric transport alive through its bad decades, and an invitation to the people who’ll take it further.
Paris got there first
The electric car is older than the petrol car’s victory, and its childhood was largely European. Gustave Trouvé drove a battery tricycle down the rue de Valois in Paris in April 1881. Andreas Flocken built a four-wheeled electric carriage in Coburg in 1888.
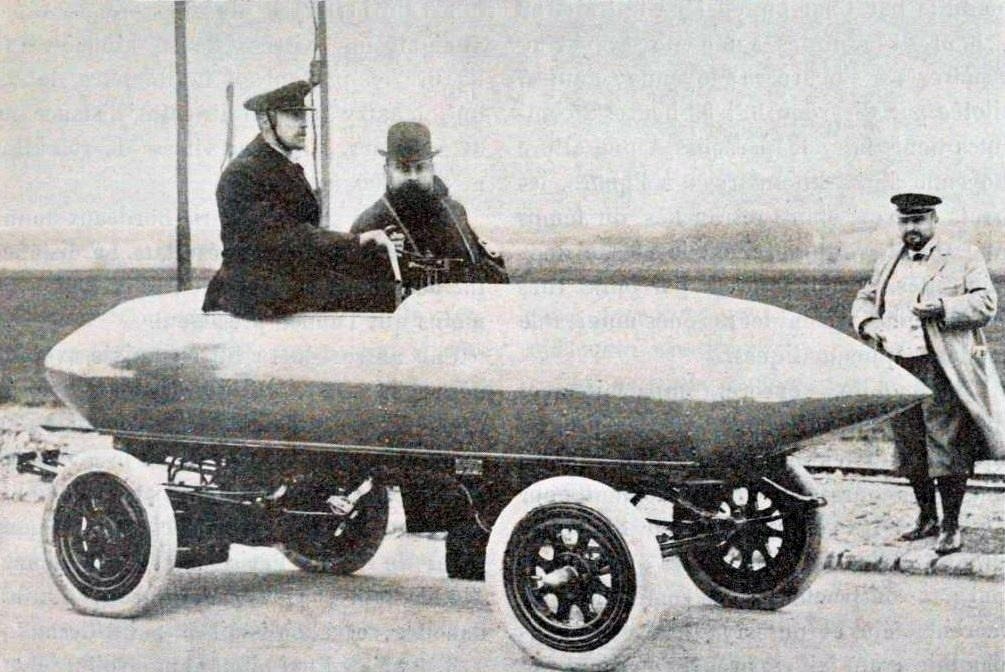
In 1899 a Belgian, Camille Jenatzy, took a torpedo-shaped electric car called La Jamais Contente to 105.88 km/h at Achères, outside Paris. It was the first road vehicle to pass 100 km/h. The name, “never satisfied”, has aged well. The industry hasn’t been satisfied since.
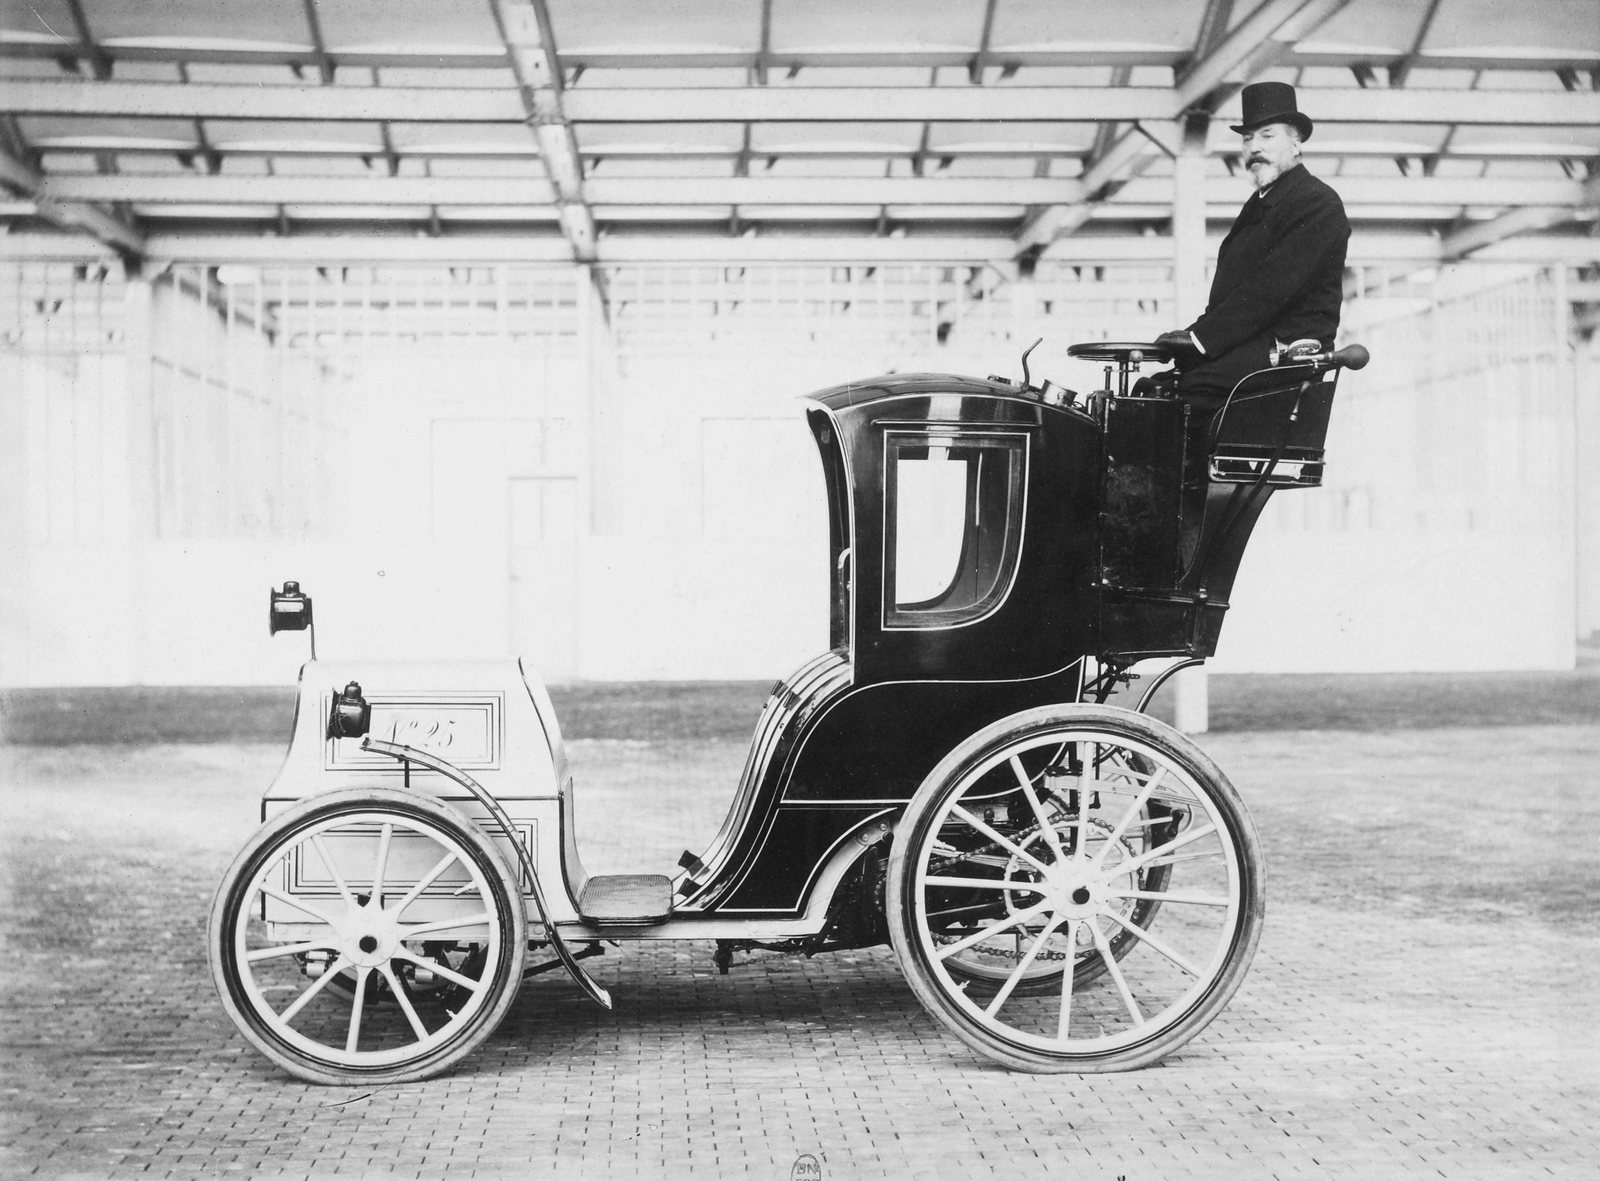
London got electric cabs in August 1897, nicknamed hummingbirds for the noise they made. There were never more than about 75 of them, and by 1900 they were gone: the batteries and tyres wore out faster than the fares came in. Any charge point operator reading this will recognise the business model problem.
New York ran on batteries
Electricity did best where the trips were short, the streets were paved and the power station was close. That meant cities, and above all it meant New York. Electric cabs worked Manhattan from 1897, and the city’s delivery fleets went electric in numbers nobody would match for a century.
By 1914, 39% of the trucks in metropolitan New York were electric. In Hartford, Connecticut, the local power company was already renting out swappable batteries from 1912 and billing truck owners by the mile. Battery as a service, a full century before the pitch decks.
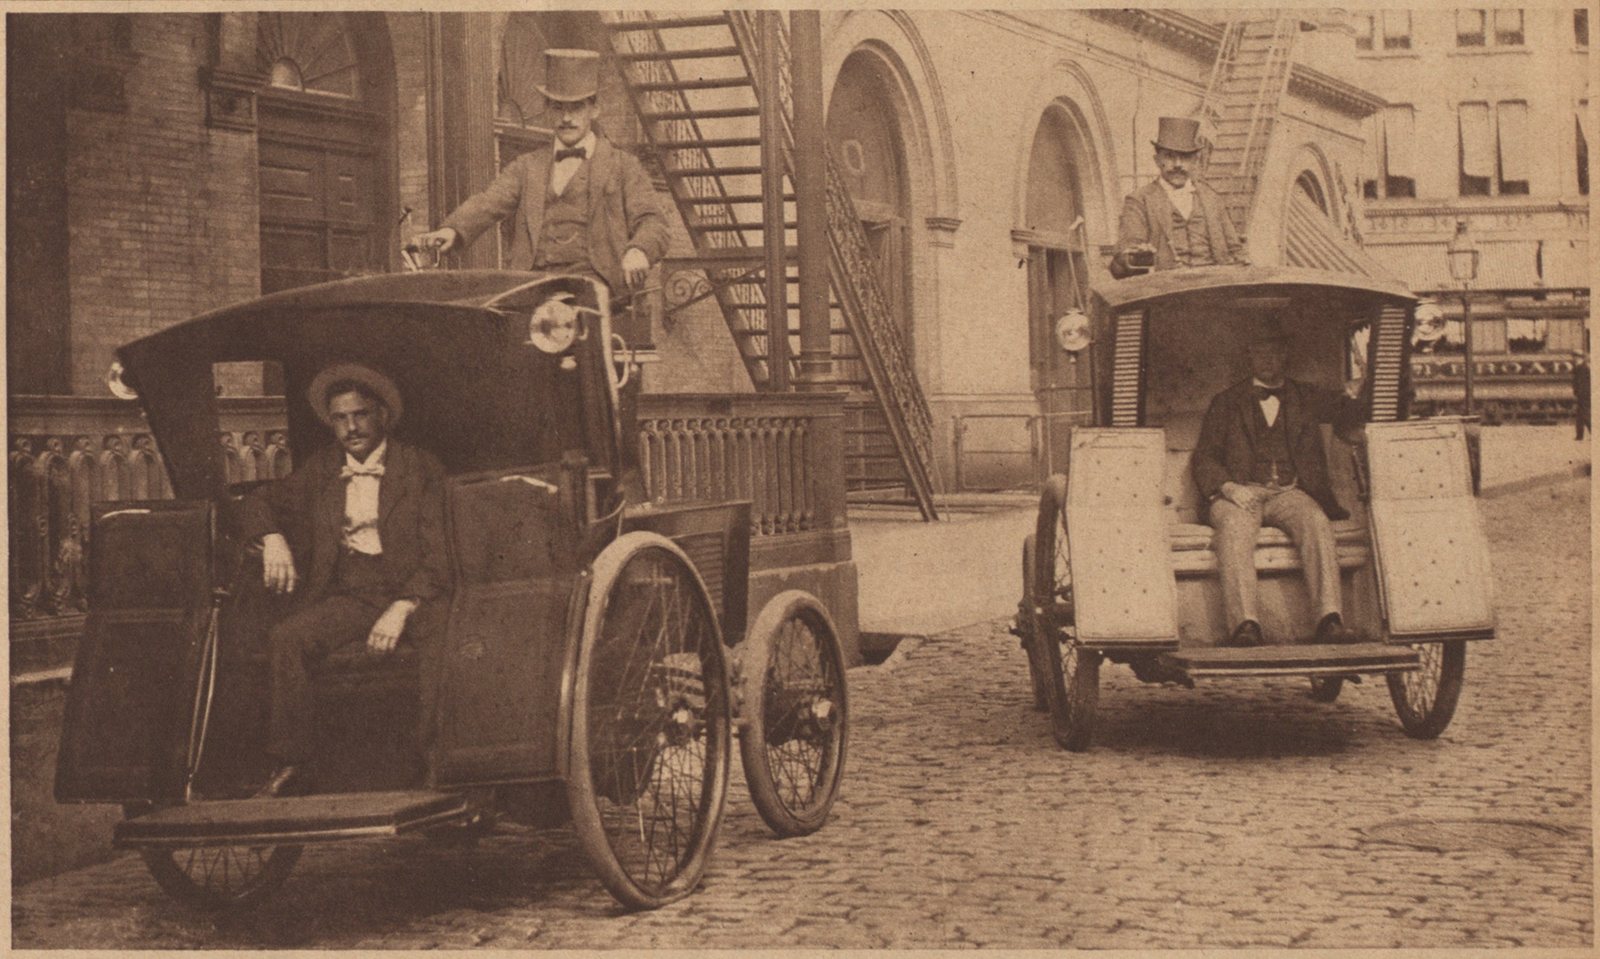
Here’s the number that stopped us. On 1 January 1921 New York City still had 4 362 electric trucks and vans at work, and almost 2 900 of them had been on its streets since 1916 or earlier. Between 2011 and 2014, with the Nissan Leaf on sale, New Yorkers registered about 1 600 plug-in cars in total.
Put plainly: a century before the modern electric car, New York had more electric vehicles on its streets than it would have in 2010.
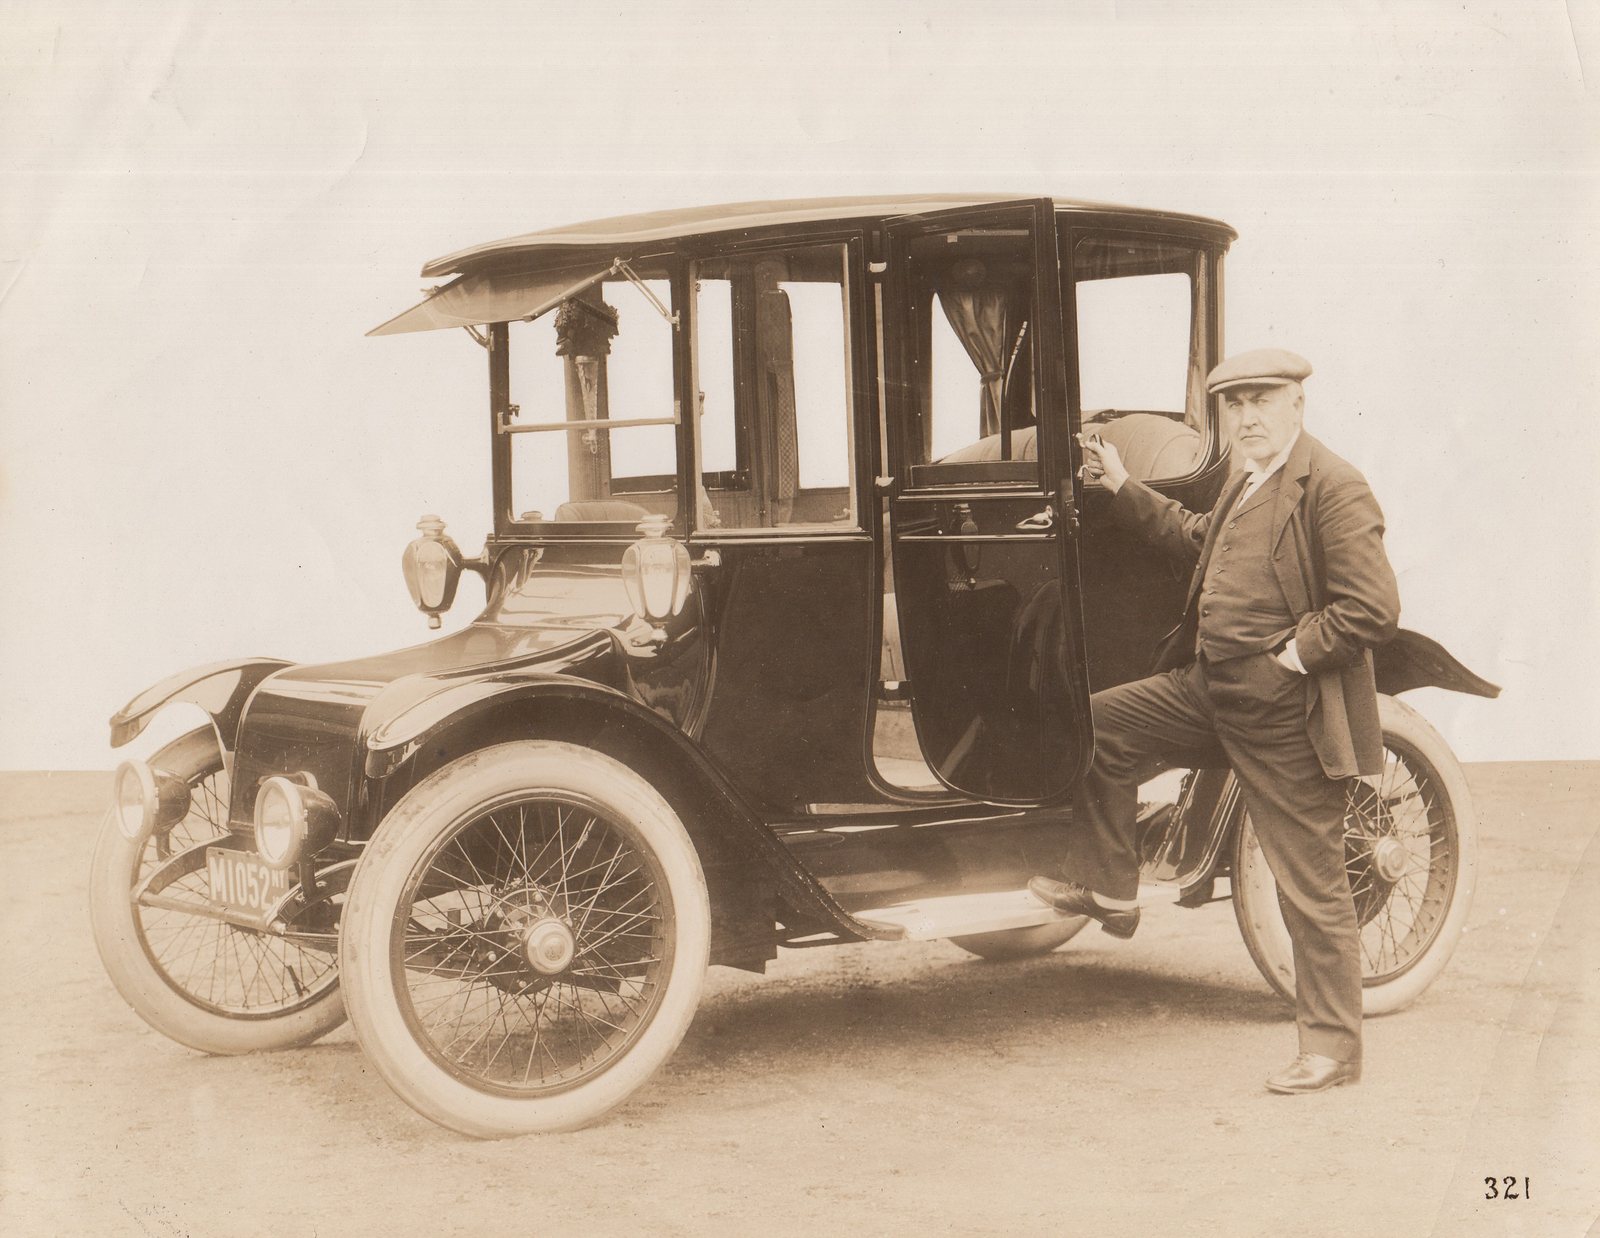
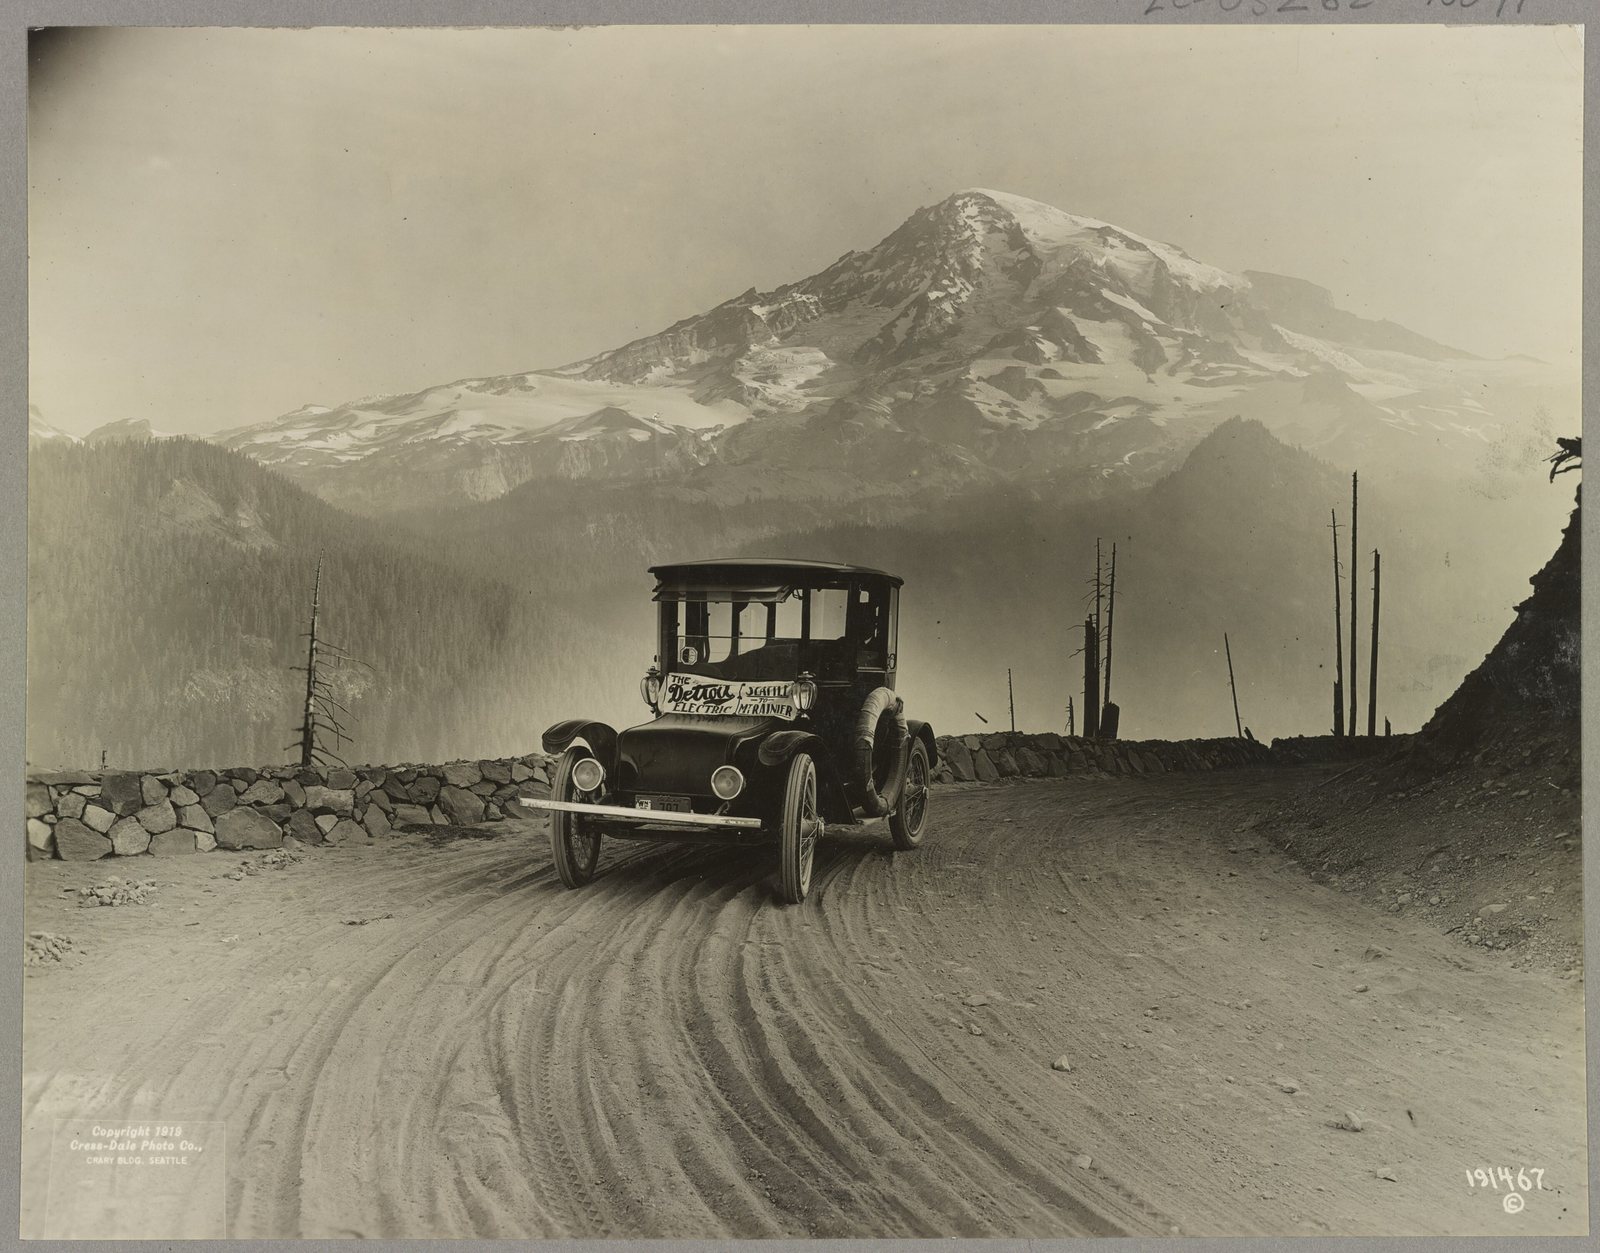
Petrol won, and not on speed
The first electric age didn’t lose a race. It lost three arguments, one after another.
The first was the crank. Starting a petrol car took muscle, and sometimes a broken wrist, until the 1912 Cadillac arrived with Charles Kettering’s electric self-starter. Electricity’s biggest gift to the petrol car turned out to be the button that started it.
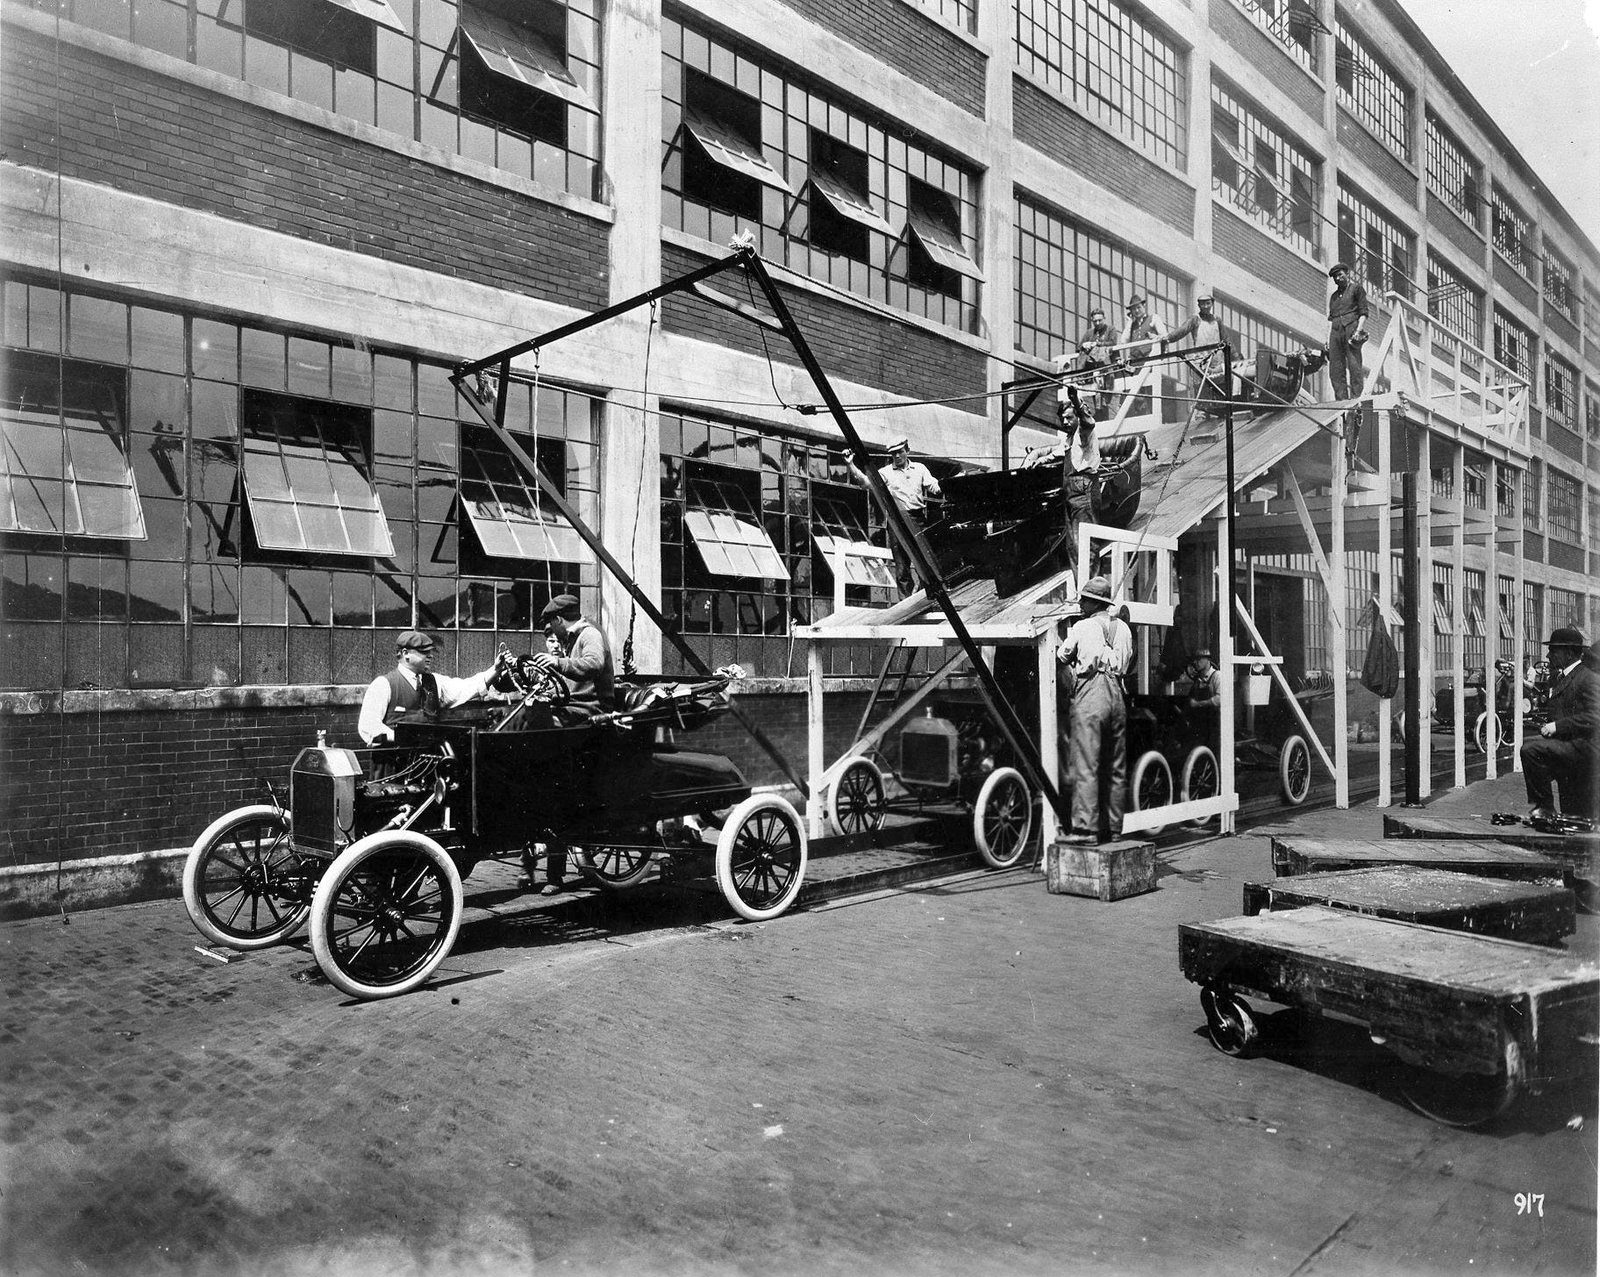
The second was price. Ford’s moving assembly line took the Model T from USD 850 in 1908 to under USD 300 by 1925. In 1912 the US Department of Energy puts a petrol car at USD 650 and an electric roadster at USD 1 750.
The third was the grid. In 1917 only 7 million of 22 million American homes had electricity. A 2021 study in Nature Energy argues that if the grid had spread 15 to 20 years earlier, most carmakers would probably have chosen electric. The electric car didn’t lose to petrol so much as to the lack of a socket.
The speed of the collapse is the sobering part. Electric cars were 38% of American car production in 1900. By 1909 they were 3%.
The long winter
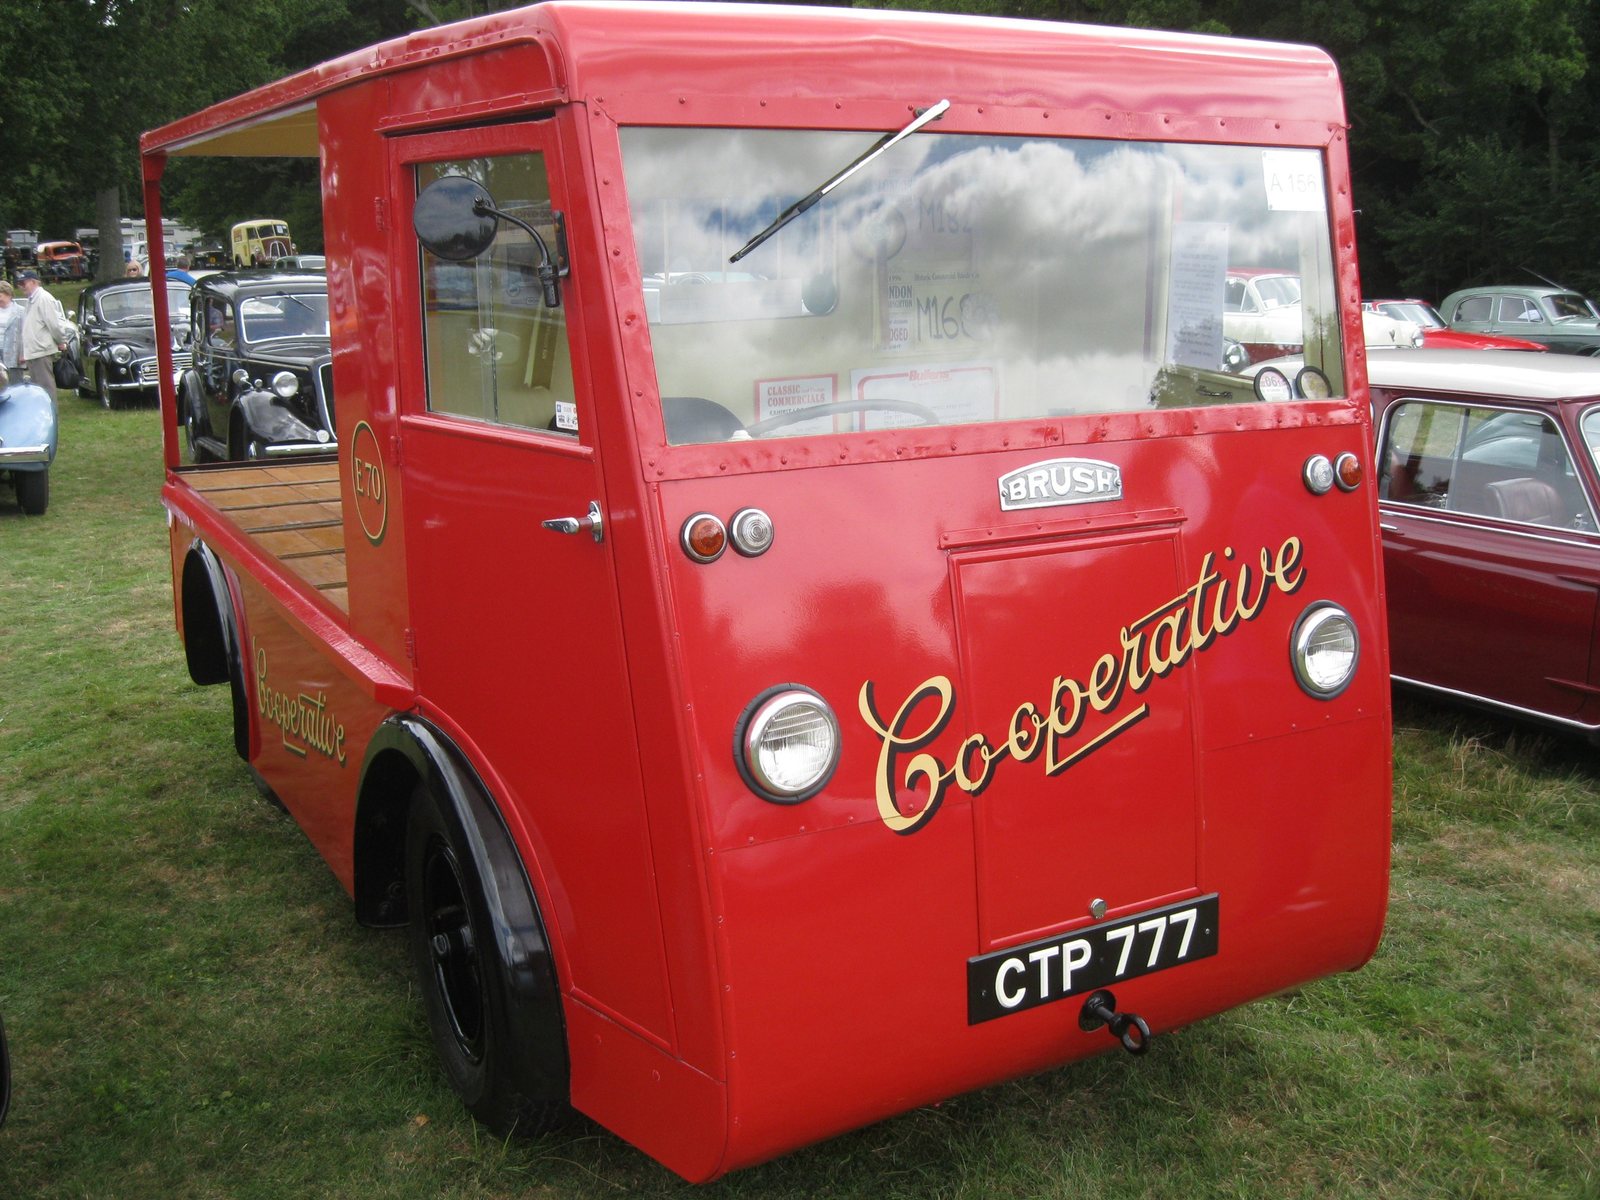
For the next 60 years electric vehicles survived where the routes were short and the stops predictable. In Britain that meant the milkman. In 1967 the industry claimed Britain had more battery-electric vehicles than the rest of the world combined, almost all of them milk floats. The world’s largest EV fleet operator, for a while, was the morning dairy round.
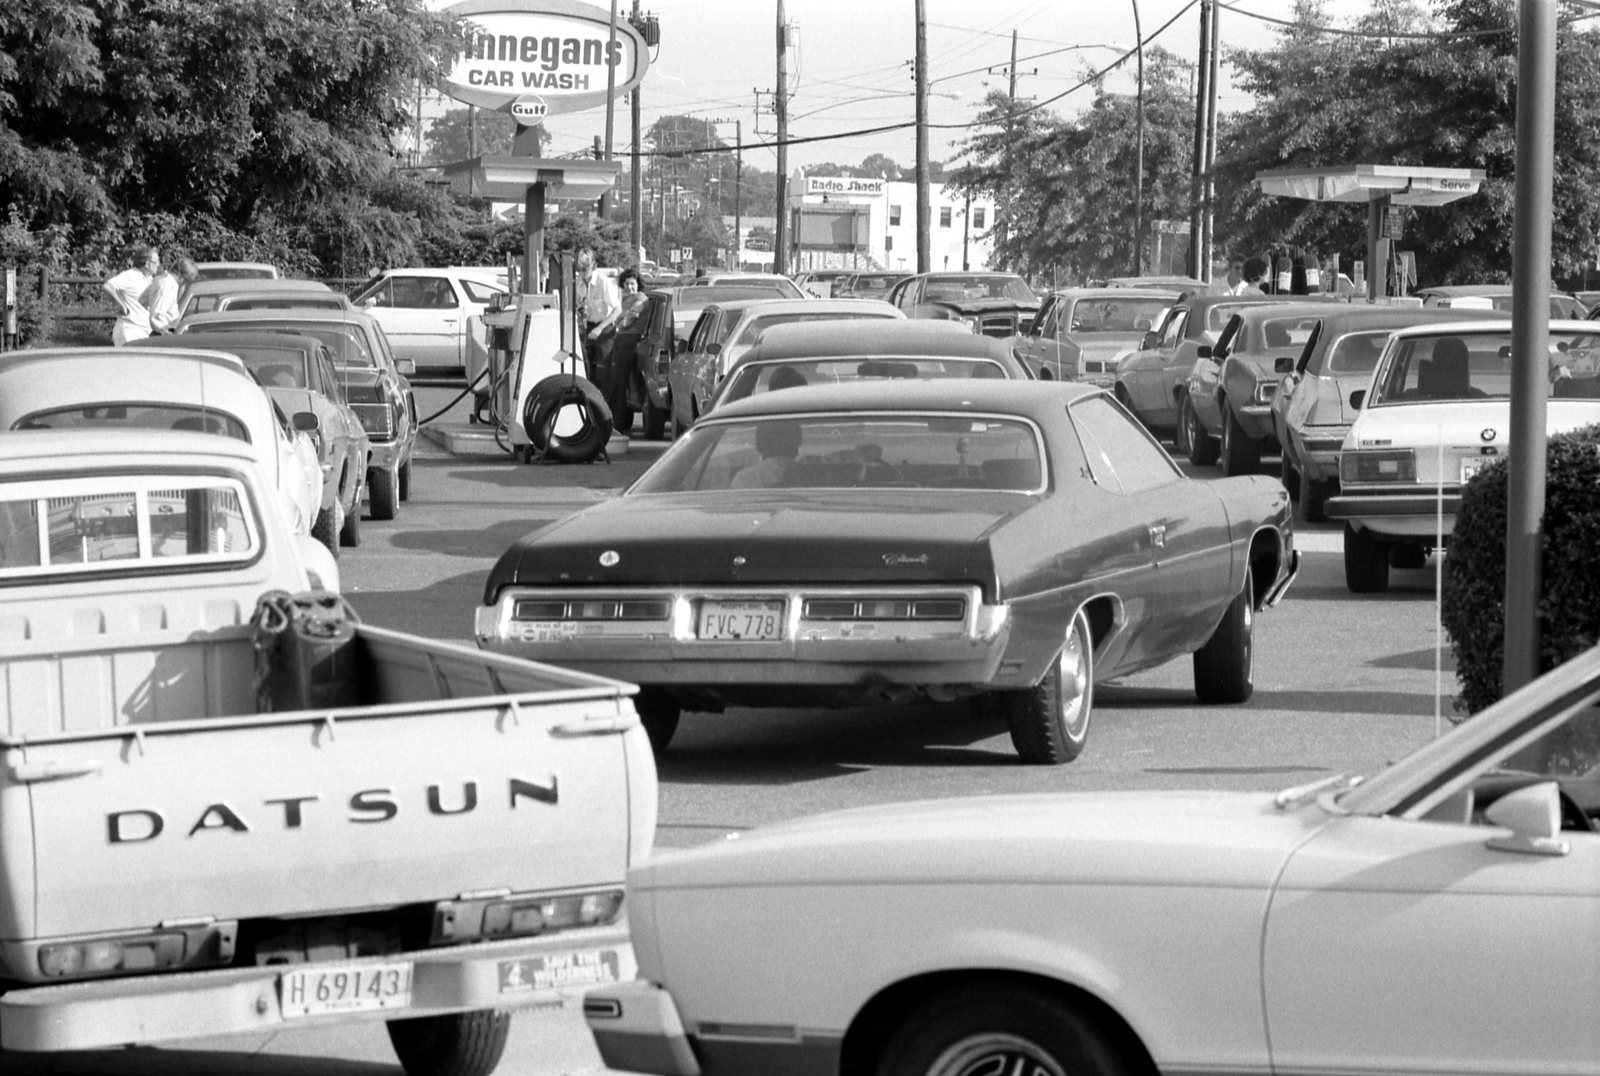
Every oil shock woke the idea up, and every recovery put it back to sleep. After 1973 came the CitiCar, a wedge of cheese on wheels; with its successor, 4 444 were built, the most-produced American electric car until the 2010s. The Enfield 8000, designed in Britain and built on the Greek island of Syros, made about 120.
In 1990 California ordered carmakers to start selling zero-emission vehicles. GM built 1 117 EV1s, leased every one, then took them back and crushed most of them. In 2003 the drivers held a funeral.
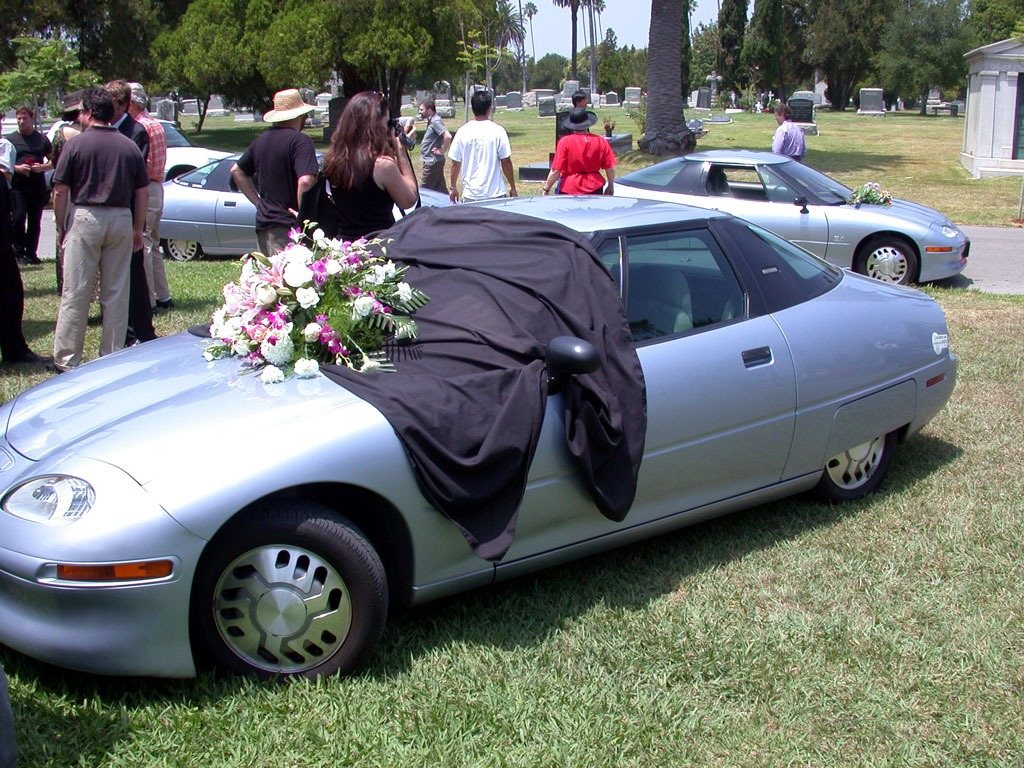
The thing that actually mattered happened somewhere else. In 1991 Sony started selling the first commercial lithium-ion cell, for camcorders. Nobody at the time thought it was a car story.
Electric share of new cars, %, 1900 to 2026
United States: electric share of motor vehicles built (US Census of Manufactures: 1 575 of 4 192 in the census year to 31 May 1900; 3 826 of 126 593 in 1909). World: electric (battery and plug-in hybrid) share of new car sales (IEA, Global EV Outlook 2026). Norway: battery-electric share of new car registrations (OFV); 2026 is January to September. No comparable series exists between 1910 and 2009, so we draw no line there.
The second electric age
Norway started early, and stubbornly. It exempted electric cars from purchase tax in 1990, gave them free toll roads in 1997 and dropped the 25% VAT in 2001, at a time when the cars on offer were Think Citys and Buddys that hardly anyone wanted. For twenty years that looked like a policy without a market.
Then the cars got good. Tesla delivered its first Roadster in 2008, Mitsubishi launched the i-MiEV in 2009 and Nissan the Leaf in December 2010. In 2010 electric cars were 0.3% of new cars sold in Norway. So far in 2026, they are 97.9%.
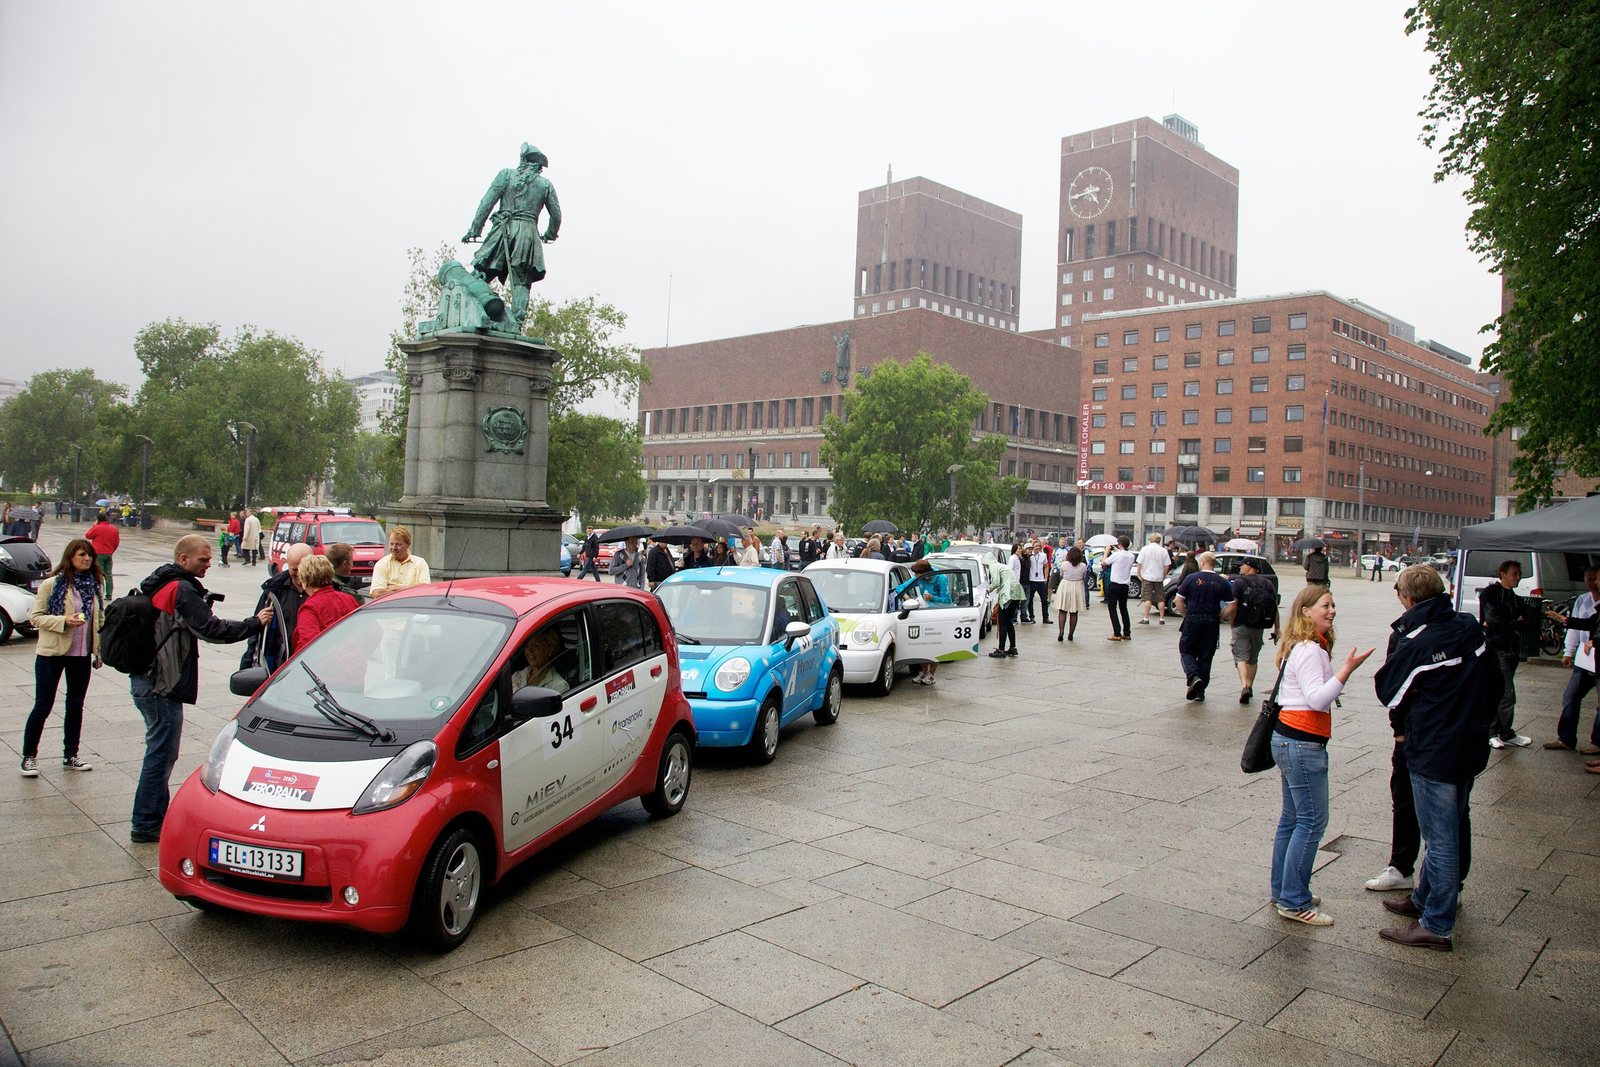
The rest of the world followed more slowly, then all at once. Electric cars went from 0.01% of global sales in 2010 to a quarter of them in 2025, 21 million cars in a year. Standards fought it out, CHAdeMO in 2010 and CCS in 2012, and in 2024 Europe made motorway coverage law with AFIR.
And the cars needed somewhere to charge. In 2010 the IEA counted 3 994 public charging points in the entire world. By the end of 2025 there were more than 7 million, most of them built in the last five years. That’s the fastest build-out of public infrastructure most of us will see in a working life.
Public charging points worldwide, millions, 2010 to 2025
IEA, Global EV Outlook 2020 (2010–2019, exact counts) and later editions (2020–2025, as published in rounded form; 2024 and 2025 are the IEA’s “more than” floors). 2023 is derived from the IEA’s reported 40% growth on 2022. The IEA revises history and changed its speed classes in 2025, so treat the series as indicative.
2100: the unpainted part
Here’s where honest forecasting stops. The IEA’s main scenarios end in 2035. BloombergNEF expects more than a billion petrol and diesel cars still on the road in 2040. Beyond 2050, nobody serious publishes a forecast, and they’re right not to.
Think how 1926 would have forecast 2026. Electric cars were a dying niche, most homes in the world had no electricity and nobody had heard of lithium-ion. Whoever travels in 2100 may not own a car, may not drive it, and may not call it charging.

What we do know is how the last 145 years were made. They were made by people who measured things, argued about them in public and wrote them down: the engineers in Paris, the utility in Hartford that rented batteries, the milk depots, the Californians who held a funeral for a car, the Norwegians who kept voting for tax breaks nobody else believed in, and the researchers and reporters who did the counting long before anyone paid them for it.
Paying it back, paying it forward
Who: researchers at universities and research institutes, students writing a thesis, journalists and NGOs. Any country, any language.
What: 12 months of Chargalytics Analytics (the charging map with live status and usage history, country dashboards, the CPO benchmark, company profiles), plus the Research API for aggregated figures by country, region and operator.
Price: one line under your chart: Source: Chargalytics (chargalytics.com).
Not included: Projects, file exports and the commercial Data API. We never hand out raw data, to anyone.
Apply here. Institutional addresses are usually approved straight away; everyone else gets a human review within two working days.
Chargalytics stands on that work too. Much of what we know about charging starts with open data: Norway’s NOBIL charger register, the volunteers of OpenStreetMap, Europe’s Copernicus climate records, and a long line of theses, papers and news stories that asked the awkward questions first.
So the people who do that work now get Chargalytics for free. Research & Press is open to researchers, thesis students, journalists and NGOs, in any country, applying in any language. It’s 12 months of our Analytics plan and the Research API, and it costs one line under your chart.
The first electric age was talked out of existence by people who didn’t have the numbers. The next hundred years deserve better ones. If you qualify, apply here. If you know someone who does, send them this.


US Census of Manufactures 1900 (Vol. X) and 1910; G. Mom and D. Kirsch, “Technologies in tension”, Technology and Culture 42(3), 2001; National Electric Light Association figures for New York City, 1 January 1921, reported in The Commercial Motor, 21 February 1922; NYC Department of Transportation, Electric Vehicle Report, 2015; US Department of Energy, “The history of the electric car”; J. Taalbi and H. Nielsen, Nature Energy 6, 2021; Autocar, 3 August 1967; IEA, Global EV Outlook 2020–2026; OFV (Opplysningsrådet for veitrafikken) registration statistics; BloombergNEF, Electric Vehicle Outlook 2026. Historical prices are in nominal US dollars. Photographs are public domain or Creative Commons, credited in each caption.