The two hardest questions in EV charging are “where should I build?” and “how well am I operating?” We’ve answered those with the location score and the execution score. But there’s a third question that keeps coming up in every investor meeting and board deck: when does this market actually get big enough to make money?
That’s what the demand model answers. It’s the base demand component of Pulse — the S-curve that determines whether your 2028 business plan is a forecast or a fantasy.
Prefer to watch? Here's the 3-minute version.
The S-curve — and the market that completed it
BEV adoption is not linear. It never was going to be. Most successful technologies — smartphones, broadband, LED lighting, colour TV — have followed a logistic curve. Slow at first, accelerating through the middle, flattening at the top. The S-curve.
Norway has given us the complete version. From 0.3% BEV sales share in 2010 to 96% in 2025. Fifteen years, start to finish. It’s the single most valuable reference market in EV charging — not because Norway is typical, but because it’s the only country where we can see the whole movie.
The shape tells us everything. The first four years barely move the needle (0.3% to 5.2%). Then the inflection hits — from 5% to 50% takes just seven years (2013–2020). Growth stays steep past 50%; only around 80% does the curve flatten as you approach saturation. The last 16 percentage points took three years (2022–2025).
This matters because the fastest growth in charging demand happens in a specific window — roughly from 10% to 60% BEV sales share. That’s where most of Europe is right now, or about to be.
Norway is a reference, not a ceiling
It’s tempting to treat Norway’s curve as a speed limit. It needn’t be. Two structural shifts mean later markets could accelerate faster through the steep part of the curve. Our central forecasts stay more cautious, though: Sweden roughly matches Norway’s pace, and the other markets are slower.
The supply side has transformed. Norwegian early adopters in 2013 chose between a Nissan Leaf with 120 km real-world range and a Tesla Model S that cost more than many apartments. Today, a German or Spanish buyer walks into a market with dozens of competitive BEVs across every segment — from the Citroën ë-C3 at under €24 000 to electric SUVs with 500+ km range. The vehicles are better, cheaper, and actually available. That removes the single biggest brake on the early curve.
Economics are replacing policy as the primary driver. Norway’s early ramp was policy-fuelled: VAT exemptions, toll waivers, bus lane access. Those incentives worked, but they were expensive and politically contingent. The markets now entering the steep phase are increasingly driven by something more durable: consumer economics. As battery costs decline and BEVs reach price parity with ICE vehicles, the purchase decision becomes a spreadsheet exercise, not an ideological one. That’s a more sustainable growth engine than any subsidy scheme.
We’d argue that long-term EV adoption will primarily be driven by economics. Everything else — emissions reduction, energy security, air quality — is a welcome bonus. When it’s simply cheaper to drive electric, the S-curve takes care of itself.
One continent, different clocks
Same curve, different timing. Here’s where the major European markets sit in 2025:
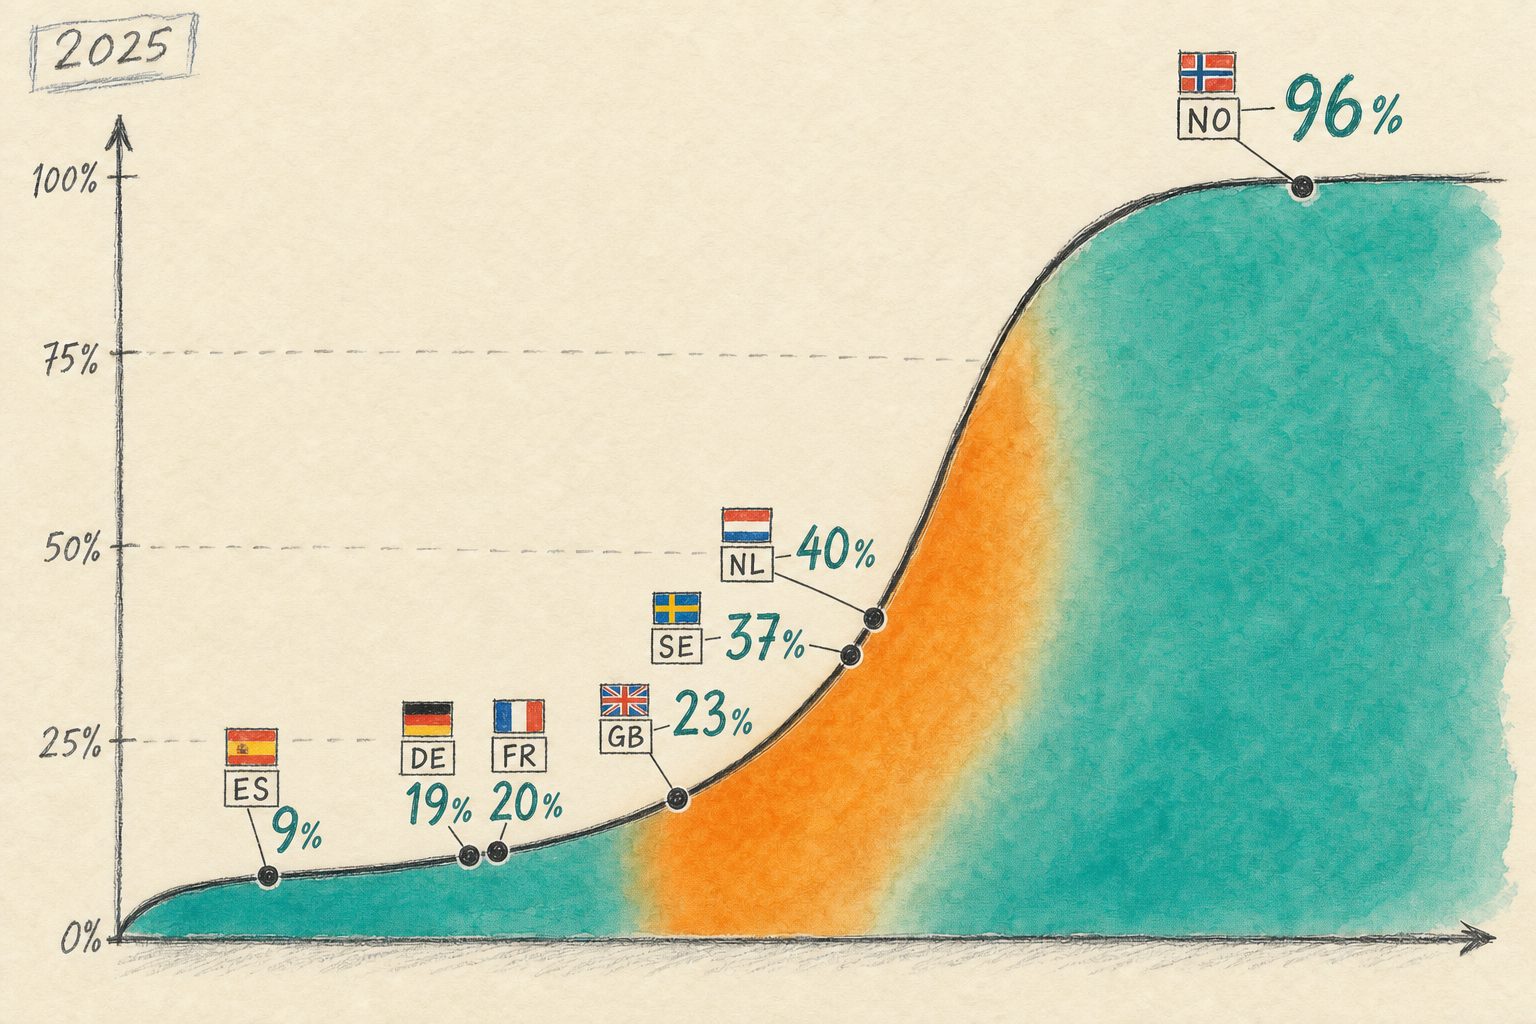
Norway is done. The Netherlands and Sweden are deep into the acceleration phase. The UK, Germany, and France are entering it. Spain is still in the early ramp. One continent, five different acts of the same play.
The practical consequence: if you’re a CPO operating across markets, your German portfolio is about to enter the growth phase that Norway went through in 2014–2020. Your Spanish portfolio is only now reaching the start of that window (11% on our 2026 forecast) and won’t reach Germany’s current share until around 2028. Same company, radically different capital timelines.
How we build the forecast
We don’t use a single forecast. We fit three scenarios — low, central, and high — using a logistic curve calibrated against two things:
- Historical fit. The curve is anchored to each market’s actual BEV sales data. The more data points, the tighter the fit.
- Reference curve normalisation. We compare each market’s trajectory against Norway and other advanced S-curves — the Netherlands, Sweden, Iceland. If a market is tracking closer to Norway’s pace, it gets a steeper curve. If it’s tracking more conservatively, we adjust down.
We also cross-validate the shape parameters against other technology adoption curves — smartphone penetration, broadband rollout, LED lighting uptake. Major technologies have tended to follow a logistic curve with a remarkably similar growth window: the 10%–80% transition typically takes 6–10 years in developed markets. BEV adoption in Norway completed that stretch in about nine (12% in 2014, 82% in 2023). This isn’t coincidence — it’s the nature of technology adoption when infrastructure and economics align.
What about politics?
We get asked about this constantly. A new US administration rolls back EV mandates. Oil prices spike from a Hormuz closure. A national government scraps purchase subsidies overnight. Don’t these things derail the curve?
Short term, yes. Germany’s 2024 dip from 18.3% to 13.5% after the subsidy cut is right there in the data. But zoom out and the pattern holds: the dip was followed by a recovery to 19.1% in 2025, and the underlying economics didn’t change. Batteries kept getting cheaper. Model ranges kept improving. Electricity stayed cheaper than petrol per kilometre.
Our position: political and macro events create noise on the curve, not a different curve. They can accelerate or delay the inflection by a year or two, but they don’t change the fundamental trajectory. When it’s cheaper to drive electric — and we’re at or near that point in most European markets — adoption becomes an economic inevitability. The scenarios capture this uncertainty: the low scenario prices in sustained political headwinds, the high scenario prices in tailwinds. The central scenario assumes the economics do the heavy lifting.
Here’s what that looks like for Germany:
Germany sits at 19% BEV share in 2025 — right at the foot of the steepest part of the curve. Note the 2024 dip after the subsidy cut: real, painful, and already recovered. The central scenario puts Germany at 50% by 2030 and 78% by 2035. The low scenario: 28% by 2030. The high: 66%.
Under the central scenario, Germany’s public charging demand grows about 3.6-fold between 2025 and 2030. Under the low scenario, where sales share reaches only 28% by 2030, it grows far more slowly. The difference between those two futures is measured in years of negative cash flow for every CPO operating in the market.
From sales share to charging demand
BEV sales share tells you how fast the fleet is turning over. But charging demand depends on stock — how many BEVs are actually on the road — not just how many were sold this year. Germany sold 545 000 BEVs in 2025, but the total fleet is 2 million. That’s 4% of the 49 million vehicles on German roads.
The conversion chain from sales share to charging revenue looks like this:
- BEV sales share (%) → cumulative BEV stock on the road
- BEV stock × average annual kWh consumption per vehicle → total electricity demand
- Total demand × public charging share → public charging demand pool
- Public demand pool ÷ installed charger capacity → system utilisation
That last number — system utilisation — is what determines whether a CPO makes money. And it’s driven by the ratio of demand growth to supply growth. In most European markets today, supply (installed chargers) is growing faster than demand (BEV fleet). That keeps utilisation low. But the S-curve guarantees demand will catch up — the question is when.
The Pulse formula, completed
The demand model provides the national-level demand pool that grows with the S-curve. The location score distributes that demand across the network based on site quality. The execution score adjusts for operator performance.
Three components, each explained:
• Base demand — this article. The S-curve-driven national demand pool.
• Location score — how we score every station. Site quality based on traffic, population, amenities.
• Execution score — how we rate every operator. What the CPO controls: pricing, uptime, brand pull.
Together, these three variables let us estimate the charging volume at any station, in any market, under any demand scenario. That’s the engine behind every Pulse valuation, every portfolio analysis, and every profitability forecast we produce.
When does the money arrive?
This is where it gets practical. In our project work — valuations, network planning, M&A due diligence — the question that comes up most is: when does this portfolio become profitable?
The answer isn’t just about demand. It’s about demand relative to supply. And this is where the charging market’s structure matters.
The oligopoly problem
EV charging is an oligopoly. In most European markets, three to five operators control the majority of fast-charging capacity. That means the decisions of your competitors directly affect your profitability. Total market demand gets distributed across total market supply — and if the market overbuilds, everyone’s utilisation drops.
This is the scenario that keeps CPO CFOs awake. You can pick excellent locations, operate flawlessly, price competitively — and still lose money if the market has collectively installed more capacity than demand can absorb. The S-curve guarantees demand will eventually catch up, but “eventually” can be an expensive word when you’re servicing debt on deployed hardware.
The counter, of course, is to choose better locations and execute better than peers. A CPO with a location score well above the market average will capture more than their fair share of demand, even in an overbuild scenario. But the risk is real, and any honest profitability forecast needs to account for it.
How we model this in Projects
In our Projects module — the tool we use for CPO valuations and network development analysis — we don’t just project demand in isolation. We estimate a throughput per bay going forward, based on a general principle: the long-term build rate in any market will trend toward the breakeven utilisation level for that market.
The logic is straightforward. If utilisation is well below breakeven, rational operators slow their buildout — or exit. If utilisation exceeds breakeven, the returns attract new entrants and accelerate deployment. Over time, the market self-corrects toward an equilibrium where the marginal station is roughly breakeven. This is the gravitational pull that shapes every charging market’s evolution.
The throughput forecast is therefore a function of two inputs: the demand forecast from our S-curve model, and the profitability requirements that define breakeven for that specific analysis.
Here’s what the demand trajectory looks like for Germany under the central scenario, with illustrative profitability thresholds for different portfolio qualities:
A CPO with premium locations (top-quartile location scores) in Germany crosses the profitability threshold around 2027 under the central scenario — when demand roughly doubles from today’s level. An average portfolio gets there around 2030, when demand is about 3.5 times today’s level. Below-average locations? 2033 at the earliest.
But remember: these thresholds assume the market self-corrects toward equilibrium. In an overbuild scenario — where operators keep deploying despite low utilisation — the thresholds shift upward, and profitability dates slide to the right. Under the low demand scenario combined with aggressive competitor buildout, some below-average stations may never cross the line.
The demand model tells you the size of the prize. The location and execution scores tell you your share of it. And the competitive dynamics tell you whether the prize is being split among three operators or thirteen. A smaller portfolio in better spots reaches profitability years before a large network spread across mediocre sites — and is far more resilient to competitive overbuild.
Every CPO profile on Chargalytics includes the Pulse demand forecast for their operating markets. The Projects module lets you build custom profitability analyses with your own breakeven assumptions — not ours.
Start your free 7-day trial and explore the full demand model across 24 European markets.
Corrected 6 October 2026: the Norway curve figures now match the chart (5% to 50% in seven years, flattening around 80%, 10% to 80% in about nine years), Norway is no longer called a floor, Germany’s central-scenario demand grows about 3.6-fold by 2030, and the Spain timing follows our own forecast.