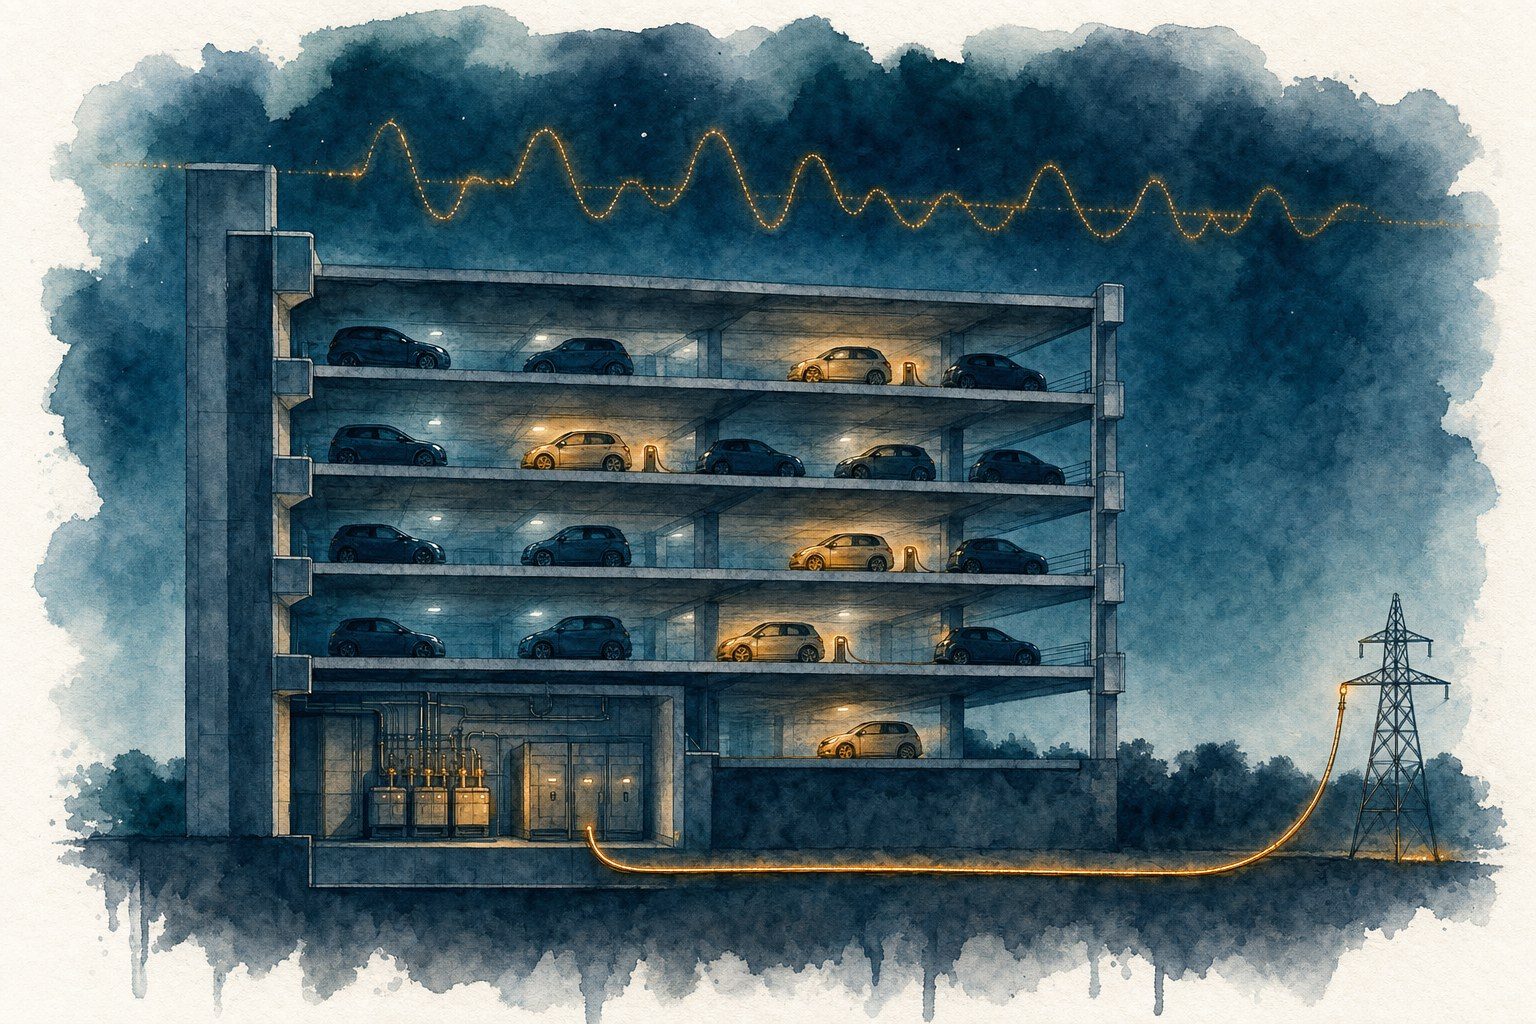
Prefer to watch? Here's the 4-minute version.
This is the full technical deep dive: method, data, model and sources. A plain-language summary of the same analysis is published as an Insight: What a parked electric car is actually worth.
Vehicle-to-grid has been five years away for twenty-nine years. The paper that named it came out in 1997, the first commercial hub opened in 2016, and every forecast in between put the turn of the corner just over the horizon. What makes 2026 different is not the technology, which has worked in trials since Delaware. It is that, for the first time, the sentence can be tested against data: the fleet is large enough to measure, the wallboxes are on sale, and the markets that would pay have published their prices. So we measured, and this piece is the result. It starts with the history, because the history is the reason to be careful.
The idea that a parked car is a power station is older than most of the cars in our panel, and the five years have rolled forward with the calendar. A short, unfair history.
In 1997 Willett Kempton and Steven Letendre wrote the paper that named the thing: the batteries in electric cars, added up, would exceed the generating capacity of every power station in the country many times over, and the trick was not bulk energy but responding at the moment the grid asked. There were, at the time, almost no electric cars. The same group worked out the economics in 2005: the money was in frequency regulation and reserves, not in baseload, and a single car could in principle earn thousands of dollars a year doing it. That paper is still cited in most V2G business plans, twenty years on.
The forecasts began once the Leaf existed. In November 2011 Pike Research counted nearly 100 000 V2G-enabled vehicles by 2017. In May 2012 Nissan launched LEAF to Home in Japan, a year after Fukushima, and the car became a backup generator for the house before it became anything for the grid. In March 2015 Navigant put vehicle-grid revenue at about 21 million dollars a year by 2024, and in August 2016 Nissan, Enel and Nuvve opened the world’s first fully commercial V2G hub: ten electric vans at a utility car park in Frederiksberg, Copenhagen.
In February 2018 the British government funded 21 V2G projects with 30 million pounds, trialling some 2 700 vehicles; Electric Nation and Powerloop, which we lean on for plug-in behaviour later in this piece, come from that round. In December 2019 Navigant moved its number to 1.4 billion dollars by 2030. In April 2022 Utrecht declared itself the world’s first bidirectional region with 150 shared Ioniq 5s. In 2025 Octopus put a V2G tariff on sale in Britain, Renault put one on the 5 in France, and in 2026 Volkswagen, BMW and E.ON shipped the wallboxes. From 2027 AFIR requires the bidirectional protocol on new public AC points.
Read the dates and every one of them was announced as the turn of the corner. The trials, to be fair, worked: the cars did regulate frequency in Delaware, Copenhagen and Utrecht. What never existed until now was a fleet large enough to matter, a wallbox you could buy, a protocol everyone spoke and a tariff that paid, in the same country at the same time. The first of those four is the one our data can speak to, and it has changed more in the last three years than in the previous twenty-five. Which is why the rest of this piece is about the fleet, not the technology.
Part 1. The supply side: what 408 000 public bays show about who is plugged in at each hour, and an estimate of the whole fleet to 2030.
Part 2. The demand side today: the two pools a car can sell into now, the reserve auctions and the household or building bill.
Part 3. The demand side tomorrow: measured price spreads since 2019, negative hours, the inertia question, the battery pipeline and what the market has learned.
Part 4. Supply meets demand: three scenarios for what one car, and the whole fleet, nets in 2030.
What it adds up to: the conclusions, by reader.
Part 1. The supply side: how much of the fleet is on the cable, and when
A power plant is described by three numbers: how much capacity it has, when it is available, and what it costs to run. For the distributed battery in Europe's electric cars the third is close to zero and the first two are unknown, because nobody meters a parked car. This part measures what can be measured, the public Type 2 network hour by hour in eleven countries, and then scales it to the fleet on stated assumptions. Everything in it is supply. Whether anyone pays for that supply is Part 2.
408 656 public Type 2 bays in eleven countries, all present in both July and August 2026. A bay counts as holding a car for every second its connector reports charging or blocked, divided by bays and wall-clock time. That is the share of bays with a car on the cable, hour by hour. We removed feeds that fail a plausibility test and corrected for two of our own measurement caps that cut overnight sessions short. Every number is a floor, but a floor we trust.
Fast chargers get the headlines. Type 2 does the work, and it does it while nobody is watching. At midnight on a weekday in August, 20% of the Netherlands' public AC bays had a car on the cable: about 31 000 vehicles tethered to a kerbside post, doing nothing until morning. In Oslo's municipal streets it is 37%. In Stockholm the same plug is busiest at nine in the morning, in a company car park.
That is the raw material of vehicle-to-grid: not the battery, which is a given, but the hours the car spends attached to a wire. This part works only with what we can see: 408 000 public AC bays in eleven countries, polled hour by hour. It measures when they hold a car, explains why the hours differ from market to market, and checks them against the hour each grid peaks. Every conclusion is about the public network and nothing else until the last section, which estimates the driveways and car parks we cannot see.
One plug, three shifts: what the public bays show
Sort the countries by the hour their public AC bays are fullest and they fall into three groups. This is the public network only: kerbside posts, car parks and destination sites, not the wallbox in the garage. The night shift is the Netherlands and Norway: bays fill from 17:00, peak around midnight and empty after 07:00. The day shift is Sweden, Finland and Switzerland: bays fill at 07:00, peak at nine or ten, and hold a car in only about 8% of bays at two in the morning. The all-day shift is Germany, Italy, France and Greece: a flatter curve that fills by mid-morning, stays busy through the evening and never quite empties.
Night shift: kerbside residential: share of public Type 2 bays with a car, by weekday hour, August 2026
Fixed panel of public AC bays present in both July and August 2026, weekday average, local time. Plugged in = charging or blocked seconds ÷ bays × wall-clock. Norway, Sweden and the Netherlands are corrected for our own measurement caps.
Day shift: workplace: share of public Type 2 bays with a car, by weekday hour, August 2026
Same panel, same measure, same month.
All-day shift: destination: share of public Type 2 bays with a car, by weekday hour, August 2026
Same panel, same measure, same month.
The reason is not the plug. It is who owns the car and where it sleeps. In the Netherlands only 27% of households can park on their own land, and 64% of new EVs are lease cars. A Dutch public post is, functionally, a home charger that happens to stand on the pavement; the national charging survey finds drivers without home charging do 63% of their kilometres on public AC. In Norway ownership is private, private leasing is only 16% of sales, and around nine in ten owners charge at home; what is left for the public AC network is the flat-dwelling city core, so it behaves like Amsterdam. Sweden is the mirror image: only about a third of new cars are registered by private persons, a company car comes with a workplace socket, and the public AC network is largely the car park under the office. Germany sits in between, with roughly two thirds of new BEVs going through commercial channels and a public network built around destinations rather than kerbs.
Oslo: municipal kerbside bays versus a destination operator, weekday hour of day, August 2026
Oslo Kommune 2 297 kerbside AC bays, corrected for our measurement cap; Mer Norway 1 662 AC bays in the same panel, as measured. Weekday average, local time.
Norway shows both patterns inside one country. Oslo's municipal kerbside network holds a car in 37% of its bays from midnight to 04:00 and barely moves until the morning departures start at 05:00. Mer Norway's destination sites do the opposite: they fill from 09:00 and empty by 18:00. Add the two together with the rest of the country and the national public AC curve flattens to about 14% around the clock. Sweden keeps its workplace shape all the way down: 8% of bays hold a car overnight, 17% at 08:00.
Two consequences follow, both about the public plant. The night-shift countries hold their cars on the cable through exactly the hours a grid has nothing better to do, which makes them ideal for charging and useless for evening peak shaving unless the car is already there at 17:00. As it happens, in the Netherlands it mostly is: 18% of bays are full at 17:00 against 20% at midnight. The day-shift countries hold their cars during solar hours and give them back at 16:00, which is the wrong direction for an evening peak and the right one for soaking up midday surplus.
When the cars are on the cable, and when the grid wants them
A parked battery is only worth something at the hour the system is short. Our plug-in curves are from August, so we held the grid to the same month: for each country we took the average weekday load for August 2026 from Energy-Charts, found the hour it peaks and read the public plug-in curve at that hour. Load here is what the grid actually has to serve, net of rooftop solar, which is why the summer peaks in the Netherlands, Spain and Italy fall after dark and the German one lands at 11:00. The chart puts the share of bays with a car at that hour next to the share at the country's own busiest hour. The gap between the two bars is the part of the public plant that has already gone home, or has not yet arrived. What happens in private garages at that hour is a question for the last section.
Bays with a car at the hour the grid peaks, versus at the country’s own plug-in peak (weekday, August 2026)
Grid peak hour = the hour with the highest average weekday load in August 2026 (Energy-Charts, local time), shown after each country name; load is what the grid serves, net of rooftop solar. Plug-in peak = the busiest hour on the corrected weekday curve. Spain starred: its session lengths fail our plausibility test. Britain omitted: its feed shows no daily pattern.
In summer the grid wants the public bays when they are full. The Dutch peak comes at 21:00, when the kerbside bays are 92% as full as it will be at midnight. Norway peaks at 20:00 on a curve that is flat around the clock. Italy and Spain peak after dark too, with their bays at or near their evening high. The workplace countries get the same luck from the other direction: Sweden's summer load peaks at 11:00 and Finland's at 13:00, in the middle of the working day, with the bays 97% and 95% as full as at their own peak. France and Greece peak at 14:00, on their afternoon plateau.
The exceptions are destination markets whose cars keep different hours from the grid. Switzerland's load peaks at 19:00, after the day-shift plant has left: 8% of bays hold a car then, against 12% at 10:00. Germany is the mirror image: its summer peak is at 11:00 and its public bays fill towards the evening, so they are 74% as full at the peak as at 19:00.
Winter is the harder test, and we can only run it where we have January plug-in curves. For Norway and Sweden we do, from an older fixed panel of bays. Sweden's January load peaks at 17:00; its bays held a car in 13% of cases at that hour against 26% at 11:00, so half the workplace plant had clocked out before the grid needed it. Norway's January load is highest at 16:00 on an average weekday, and the all-time record came between 08:00 and 09:00 on 7 January 2026: the Norwegian panel showed 16% at 16:00 and 17% at 08:00 against 25% overnight. The kerbside plant is pulling away as the grid sets its records. The French and Italian winter peaks move to 09:00 in the morning; we will run the same check there when January curves are in.
| Country | August load peaks at | Bays with a car then | Bays at their own peak | Verdict |
|---|---|---|---|---|
| Netherlands | 21:00 | 19% | 20% at 00:00 | On shift |
| Norway | 20:00 | 14% | 14% at 20:00 | On shift |
| Italy | 20:00 | 8% | 8% at 20:00 | On shift |
| Spain* | 21:00 | 11% | 12% at 13:00 | On shift |
| Sweden | 11:00 | 16% | 17% at 08:00 | On shift |
| Finland | 13:00 | 18% | 19% at 11:00 | On shift |
| France | 14:00 | 11% | 11% at 12:00 | On shift |
| Greece | 14:00 | 8% | 8% at 20:00 | On shift |
| Germany | 11:00 | 6% | 8% at 19:00 | Mostly on shift |
| Switzerland | 19:00 | 8% | 12% at 10:00 | Off shift |
So on the public network the summer plant is on shift at the right hour almost everywhere, and the two exceptions are destination markets whose cars leave before, or arrive after, the peak. In winter, where we can check, the picture turns: the workplace plant clocks out before the Swedish peak and the kerbside plant is leaving as Norway sets its records. Where the plant is off shift its value is not peak shaving at all but absorbing midday solar and wind, which is a real service and a different business model.
Winter makes the plant bigger and the need larger
An electric car uses far more energy in winter: cabin heat, battery conditioning, snow and higher rolling resistance. NAF’s 2025 winter test found an average 19% range loss between minus six and plus eight degrees; the 2026 test, run down to minus 32, found 38%. Geotab’s five-million-trip dataset puts usable range at 54% of rated at minus 15. More energy per kilometre means more charging sessions, and more sessions means more hours on the cable.
Public AC bays with a car versus weekly mean temperature, Norway and Sweden, August 2025 to January 2026
Fixed panel present every month Aug 2025–Aug 2026: Norway 4 648 bays, Sweden 9 894. Weekly means, Monday-dated. Temperature: Open-Meteo ERA5 reanalysis, population-weighted city points. Series stop at 31 January 2026: two pipeline changes (1 February and 3 March 2026) break comparability after that (see fact box).
Our fixed Norwegian panel shows it: public AC occupancy rose from about 15% in September to 20% in January, and the daily series tracks temperature at r = −0.68 (Open-Meteo reanalysis, population-weighted). Sweden does not follow temperature at all (r = −0.08); only the Christmas fortnight moves it, when the offices empty and occupancy drops from 15% to 9%. That is the ownership story again: a workplace network follows the calendar, a kerbside network follows the thermometer. Both Norway's and Finland's record peaks are winter mornings, so the public kerbside plant is biggest exactly in the season the grid is tightest, and leaving the street exactly at the hour the grid is tightest.
What a plugged-in car is worth, per market
Every bidirectional product shipping in Europe in 2026 lands at about 11 kW on three-phase 400 V: Volkswagen and Elli’s BiDi charger, BMW and E.ON’s 11 kW DC wallbox for the iX3, Renault’s Mobilize box at 7 to 22 kW, Wallbox’s Quasar 2 at up to 12.8 kW. Hyundai and Kia have switched V2G on for the EV9 and Ioniq 9 in the Netherlands. The hardware ceiling for a home connection, though, is set by the house, not the car.
| Market | kW per plugged-in car | Why |
|---|---|---|
| Norway | 7 | More than 70% of homes sit on a 230 V IT network; NAF recommends single-phase, 3.7 kW at 16 A and about 7.4 kW at 32 A |
| Britain | 7 | Single-phase domestic supply; 7 kW is the standard home and V2G wallbox rating |
| Everywhere else in the panel | 11 | Three-phase 400 V; Elli BiDi 11 kW, BMW and E.ON 11 kW DC wallbox, Renault and Mobilize 7 to 22 kW, Wallbox Quasar 2 up to 12.8 kW DC |
That single-phase constraint matters most in the country with the most cars. More than 70% of Norwegian homes are on a 230 V IT network, where three-phase charging is not on offer and NAF advises single-phase at 16 or 32 A. Norway's million-car fleet therefore counts at 7 kW, the same as Britain's, while a Dutch or German car counts at 11. Volkswagen names about one million MEB cars in Europe as bidirectional-ready, which with Renault, Hyundai, Kia and BMW is the basis for our assumption that 15% of today's stock could feed back if the wallbox and the tariff existed.
From the bays we see to the fleet we do not: today and 2030
Everything above is measured. From here on it is estimated. Public AC is a small window on a big fleet: at the Dutch grid peak our bays hold about 3% of the country's BEVs, in Germany 0.2%. Most cars sleep in driveways and garages we cannot see, and nothing in the public pattern tells us whether they are plugged in. So we build the fleet-level number from three parts: the cars we measure on public bays, the cars of drivers who can charge at home multiplied by a plug-in probability for that hour, and the cars of drivers with a workplace socket, likewise. The probabilities come from the trials that have measured them: Electric Nation found cars plugged in for over 12 hours per session and charging two to three times a week, which puts a home car on the cable on 30% to 45% of nights, and Octopus Power Pack asks its V2G customers for 12 hours a day on 20 days a month. The inputs are in the table so they can be argued with.
| Input | Value | Source |
|---|---|---|
| Cars on public AC bays | Measured on our panel, hour by hour, corrected for caps | This article |
| Share of drivers who can charge at home | NO 90%, NL 50%, SE 52%, GB 68%, DE and FI 75%, FR 65%, CH and IT 60%, ES 55%, GR 50% | IEA; Nationaal Laadonderzoek; WEVJ; English Housing Survey; rest assumed |
| Home car on the cable, 22:00 to 06:00 | 30% to 45% of home-charging cars | Electric Nation: plugged in over 12 h, 2 to 3 charges a week; Octopus Power Pack asks 12 h a day on 20 days |
| Home car on the cable, 09:00 to 17:00 | 5% to 10% | Assumed |
| Share with workplace charging | SE 35%, NL, DE and FI 30%, CH and GB 25%, FR, IT and ES 20%, NO and GR 15% | Company-car shares; Nationaal Laadonderzoek lease drivers charge 21% of km at work |
| Workplace car on the cable, 08:00 to 16:00 | 25% to 40% of those with workplace charging | Assumed, mirrors the Swedish public curve |
| Fleet 2026 to 2030 | EAFO end-2025 stock, Chargalytics base forecast | EAFO, KBA, Eurostat |
| Bidirectional-ready share | 15% of 2025 stock; 20% rising to 60% of net additions | Volkswagen (about one million MEB cars), Renault, Hyundai and Kia, BMW |
| Country | August peak | BEV fleet 2026 | Plugged in at grid peak, share of fleet | GW whole fleet | MW V2X-capable | GW V2X-capable 2030 |
|---|---|---|---|---|---|---|
| Germany | 11:00 | 2 584 000 | 11 to 20% | 3.2 to 5.6 | 521 to 898 | 3.0 to 5.2 |
| France | 14:00 | 1 852 000 | 8 to 15% | 1.7 to 3.0 | 271 to 473 | 1.1 to 2.0 |
| Great Britain* | 19:00 | 2 205 000 | 12 to 19% | 1.9 to 2.9 | 298 to 466 | 1.7 to 2.7 |
| Netherlands | 21:00 | 790 000 | 17 to 23% | 1.4 to 2.0 | 225 to 316 | 0.7 to 1.0 |
| Norway | 20:00 | 1 049 000 | 20 to 30% | 1.4 to 2.2 | 223 to 343 | 0.6 to 0.9 |
| Sweden | 11:00 | 502 000 | 12 to 20% | 0.7 to 1.1 | 106 to 174 | 0.4 to 0.6 |
| Spain* | 21:00 | 408 000 | 15 to 22% | 0.7 to 1.0 | 109 to 164 | 1.2 to 1.8 |
| Italy | 20:00 | 477 000 | 14 to 21% | 0.7 to 1.1 | 116 to 175 | 0.7 to 1.0 |
| Switzerland | 19:00 | 290 000 | 11 to 17% | 0.3 to 0.5 | 54 to 84 | 0.2 to 0.3 |
| Finland | 13:00 | 198 000 | 12 to 20% | 0.3 to 0.4 | 42 to 70 | 0.2 to 0.3 |
| Greece | 14:00 | 45 000 | 7 to 12% | 0.0 to 0.1 | 6 to 10 | 0.1 to 0.1 |
| Eleven countries | 10 399 000 | 13 to 20% (simple mean) | 12 to 20 | 1972 to 3173 | 9.7 to 15.8 |
On those assumptions, at each country's own grid peak, between 12 and 20 GW of inverter capacity is sitting on a cable across the eleven countries today, of which 2.0 to 3.2 GW belongs to cars that could technically feed back. By 2030, with the fleet more than doubling and six in ten new cars bidirectional, the capable slice is 10 to 16 GW and 15 to 24 GWh of usable energy at the peak hour. Germany alone is 3.0 to 5.2 GW of that. Fraunhofer ISI and T&E put the backup capacity V2G could displace at 13 GW across the whole EU in 2040; our eleven countries are on that path, and ahead of it in the kerbside markets.
Bidirectional inverter capacity on the cable at each country’s August grid peak hour, eleven countries, GW nameplate
Modelled: BEV stock (EAFO 2025 actual, Chargalytics base forecast 2026 to 2030) × plugged-in share at the grid peak hour (measured public bays plus survey-based home and workplace plug-in bands) × 11 kW (7 kW in Norway and Britain). “Capable” = 15% of the 2025 stock bidirectional-ready, rising with 20% (2026) to 60% (2030) of net additions. Nameplate, not coincident output.
Part 2. The demand side today: two value pools
A parked, plugged-in, bidirectional car can be paid in two places, and they are different markets with different physics. In front of the meter, the transmission system operator buys the right to call on the car's power for seconds or minutes to hold frequency and restore balance: a pure supply-and-demand auction with a fixed need, priced by the cheapest provider willing to stand by. Behind the meter, the car moves the household's or the building's own consumption from expensive hours to cheap ones, and the value is a saving on a bill, capped by how much of the bill can be moved. The first pool is small and contested. The second is large in aggregate and thin per car. We size both at today's prices; Part 3 asks how the prices themselves will move.
Pool one: frequency and balancing reserves
Every European system operator buys the same three things: frequency containment reserve (FCR, the first seconds), automatic restoration reserve (aFRR, the next minutes) and manual reserve (mFRR, the next quarter-hour and beyond), plus a few local products. A car can technically do all three, but what decides whether it may is the rulebook: the minimum bid, whether small assets may be pooled, whether a household behind a standard meter can qualify, and whether an aggregator can act without the customer's electricity supplier. The table is the state of play in September 2026, from the TSOs' own documents.
| Country | Products | Minimum bid | Rule that bites | Cars have delivered? | Verdict |
|---|---|---|---|---|---|
| Norway | FCR-N, FCR-D, aFRR, mFRR | 0.1 MW FCR, 1 MW aFRR/mFRR | Aggregation allowed; volume caps below 110 kV since April 2026; batteries pay grid tariffs twice | mFRR pilots with home chargers (eFleks, NorFlex) | Ready on paper, prices not public |
| Sweden | FCR-N, FCR-D up/down, aFRR, mFRR | 0.1 MW FCR | Aggregation allowed; marginal pricing since 2024 | NIO swap stations in FCR-D (2025); Vattenfall/VW V2G pilot 2026 | Ready, and already saturated |
| Finland | FCR-N, FCR-D, aFRR, mFRR | 0.1 MW FCR-N, 1 MW FCR-D | Aggregated “providing groups” explicit; 10 kW resolution | Virta public chargers in FCR-D up since 2023 (charging only) | Ready |
| Denmark | FCR-N/D (DK2), FCR (DK1), aFRR, mFRR | 0.1 MW DK2 | P90 rule lets stochastic assets bid at 90% delivery probability | Frederiksberg vans in FCR-N since 2016, still running | Ready, proven |
| Netherlands | FCR, aFRR, mFRR | 1 MW | Independent aggregator must still contract with the supplier until central settlement lands | Jedlix cars in TenneT aFRR pilot 2019–20 | Ready on paper |
| Germany | FCR, aFRR, mFRR | 1 MW pools, low-voltage allowed | Each site needs 15-minute interval metering; standard-profile households excluded | Leaf prequalified for FCR at Hagen 2018; Elli V2G package from Q4 2026 | Ready, metering is the gate |
| France | FCR, aFRR, mFRR | 1 MW | Aggregation allowed | Dreev fleet pool certified for FCR, February 2022 | Ready, proven |
| Italy | FCR unpaid until June 2026 pilot; aFRR/mFRR via UVA; Fast Reserve | 1 MW | Aggregated virtual units allowed from 2025 | 25 MW V2G in Fast Reserve, Mirafiori | Plumbing being built |
| Switzerland | FCR, aFRR, mFRR | 1 MW | Aggregation allowed, cloud-to-cloud accepted | V2X Suisse, 50 cars, prequalified for FCR and aFRR 2022–23 | Ready, proven |
| Spain | aFRR, mFRR, SRAD; FCR mandatory and unpaid | 1 MW | Independent aggregator only recognised by decree in 2026 | None | Plumbing being built |
| Great Britain | Dynamic Containment/Moderation/Regulation, Balancing Mechanism | 1 MW | 20 Hz settlement metering; Powerloop chargers fell far short | No V2G unit in frequency services on record | Metering is the gate, price is the floor |
| Greece | FCR, aFRR, mFRR | 1 MW | Aggregators licensed since 2015 | None | Plumbing being built |
Read down the last column and the map is clear. The Nordic markets accept bids from 100 kW, pool anything, and ten Danish vans have been selling FCR-N since 2016; Fingrid writes aggregated providing groups into its prequalification rules and Virta already runs public chargers in Finnish FCR-D, charging only. France certified a fleet of company cars for FCR in February 2022, Switzerland prequalified fifty Hondas for FCR and aFRR, the Netherlands ran cars in TenneT aFRR as early as 2019. Germany has a prequalification guide written specifically for electric vehicles, and its gate is metering: every site needs interval metering, which excludes the standard-profile household that most drivers are. Britain's gate is the same, harder: Powerloop found the chargers’ ten-second metering fell far short of what frequency services require. Spain only recognised the independent aggregator by decree in 2026, Italy started paying for FCR at all in June 2026, Greece has licensed aggregators and no cars. Norway is ready on paper and has just capped what small assets may prequalify.
What a megawatt of frequency reserve earned per hour, 2021 to 2026, EUR per MW per hour
Yearly averages of capacity prices. Sweden: Svenska kraftnät Mimer auction export, hourly average. Germany and France: regelleistung.net daily FCR results, sampled four days a month. Britain: NESO Dynamic Containment low auction, volume-weighted, GBP converted at 1.16; 2022 derived from NESO’s reported 59% winter fall. 2026 to early September.
The price a megawatt of reserve earns is set by whoever will stand by cheapest, and since 2023 that has been a battery. Sweden’s FCR-D up averaged 127 euros per MW per hour in 2022 and 12 in 2025; a Swedish battery’s ancillary revenue fell about 90% between mid-2023 and early 2026, and the Nordic TSOs counted 670 MW of batteries prequalified for a 550 MW product. Britain’s Dynamic Containment paid 17 pounds at launch in 2021 and 2 to 4 pounds since 2023, with 7 GW of batteries connected. Germany had 1.35 GW of batteries prequalified for FCR on 1 January 2026, 2.3 times what it buys, and Modo expects aFRR to saturate within two to three years. France is the exception that proves it: FCR fell 73% from 2022 to 2024, then aFRR reopened to batteries and revenue rebounded, for now. Wherever a car can go, a container of cells got there first, needs no driver, and bids at its marginal cost.
What one bidirectional car nets a year selling reserve capacity, at 2025 prices and at a saturated price, EUR
Modelled: 7 kW bid per car (5 kW in Britain and Norway), 3 000 hours a year on the cable with headroom (the 250 hours a month Elli requires), aggregator keeps 40%. “Saturated” = 4 EUR/MW/h, roughly where Britain has settled and below Sweden’s FCR-D low. Prices: TSO auction results, 2025 averages; French aFRR is the 2025 Energy Pool estimate. No energy payments, no degradation, no metering cost.
| Country | Product a car can reach | Capacity price 2025, EUR/MW/h | Pool size, MW | Cars at full availability to fill it | Gross per car per year | After the aggregator’s 40% | Same, at a saturated 4 EUR/MW/h |
|---|---|---|---|---|---|---|---|
| Sweden | FCR-D up | 12 | 550 | 78 571 | 254 EUR | 152 EUR | 50 EUR |
| Sweden | FCR-N | 54 | 234 | 33 429 | 1128 EUR | 677 EUR | 50 EUR |
| Finland | FCR-D up, hourly market | 17 | 350 | 50 000 | 363 EUR | 218 EUR | 50 EUR |
| Denmark | FCR-N (DK2) | 54 | 60 | 8 571 | 1128 EUR | 677 EUR | 50 EUR |
| Netherlands | aFRR capacity | 27 | 340 | 48 571 | 567 EUR | 340 EUR | 50 EUR |
| Netherlands | FCR | 18 | 123 | 17 571 | 380 EUR | 228 EUR | 50 EUR |
| Germany | FCR | 15 | 528 | 75 429 | 323 EUR | 194 EUR | 50 EUR |
| Germany | aFRR capacity | 13 | 2 000 | 285 714 | 273 EUR | 164 EUR | 50 EUR |
| France | FCR | 12 | 516 | 73 714 | 248 EUR | 149 EUR | 50 EUR |
| France | aFRR capacity | 54 | 1 180 | 168 571 | 1134 EUR | 680 EUR | 50 EUR |
| Switzerland | FCR | 19 | 67 | 9 571 | 397 EUR | 238 EUR | 50 EUR |
| Spain | aFRR capacity | 13 | not published | – | 273 EUR | 164 EUR | 50 EUR |
| Great Britain | Dynamic Containment low | 5 | 1 200 | 240 000 | 69 EUR | 41 EUR | 36 EUR |
| Italy | Fast Reserve | 3 | 250 | 35 714 | 63 EUR | 38 EUR | 50 EUR |
| Norway | FCR-D up (price not public) | not public | 565 | 113 000 | – | – | 36 EUR |
Put a car in those markets on realistic terms, 7 kW bid, 3 000 hours a year on the cable with headroom, the aggregator keeping 40%, and it nets 150 to 350 euros a year at 2025 prices in most of Europe, up to about 680 in the pockets where FCR-N or aFRR still pays: Sweden, Denmark, France, the Netherlands. That squares with what is actually offered. Elli pays up to 720 euros in the first year for 250 hours a month, Dreev paid up to 20 euros a month, the Danish vans earned 1 400 to 1 900 euros a year at 2017 to 2019 prices that no longer exist. The pockets are small: the pools are 50 to 2 000 MW, which is ten thousand to a few hundred thousand cars at full availability, against millions of electric cars and 360 000 V2G-ready Volkswagens in Germany alone. Fill a pool and the price goes where Britain's has gone, and at 4 euros per MW per hour a car nets about 50 euros a year, less than its own metering. That is the shape of every flexibility market as it matures, and the cars are arriving at the end of the curve, not the start.
Pool two: behind the meter
The case every wallbox brochure leads with is the family car as the house battery. We built a simple hourly model for it. Take a year of day-ahead prices to August 2026 for each market, add the energy tax, the per-kilowatt-hour grid fee and VAT so it looks like a spot-indexed household contract, give the house a normal load curve with an evening peak and, in the north, a winter, and give the family a 60 kWh car that leaves at 07:00 on weekdays, comes back at 17:00 having used 7 kWh, and stays home all weekend. Then let a perfect-foresight controller decide each afternoon, when tomorrow's prices are published, when to charge and when to run the house from the car, within a 12 to 54 kWh window and paying two cents per kilowatt-hour for battery wear. Run it three ways: charging as soon as the car is plugged in, charging at the cheapest hours, and charging at the cheapest hours plus discharging into the house at the most expensive. The second step is smart charging and needs no bidirectional hardware. The third is V2H, and what matters is how much it adds to the second.
What a household saves per year with the car as a home battery, by market, EUR, September 2025 to August 2026 prices
Modelled on hourly day-ahead prices for the year to August 2026 (Energy-Charts), a spot-indexed household contract with each country’s energy tax, volumetric grid fee and VAT, a 60 kWh car home on weekday evenings and nights and all weekend, driving 7 kWh on weekdays, 6 kWp of rooftop solar in the “with solar” case. Perfect foresight over each 24-hour window, so an upper bound. Smart charging = shifting the car’s own charging to the cheapest hours; V2H = additionally discharging into the house. Values are the increment each step adds.
The answer, across eleven markets, is roughly 144 euros a year, and smart charging alone is worth about the same. Great Britain is the best case at 255 euros, because its evening prices are the steepest relative to the night; Italy the worst at 44, because a flat price curve and a small house leave nothing to shift. Britain is the outlier on smart charging: on Octopus Agile, where the retail price swings with the wholesale one, simply moving the car's own charging to the cheap hours is worth about 509 euros, and the extra discharge step 255. Everywhere the house is the constraint, not the battery: the car has 40 kWh of room and the evening peak of a European house is five to ten kilowatt-hours, and that is all V2H can displace.
Solar makes it worse, not better, for this family. The panels produce between 10:00 and 15:00 on a weekday and the car is at work; the surplus is exported at whatever the feed-in rule pays, and the only sun the car ever stores is the weekend's. With 6 kWp on the roof the V2H increment falls to 125 euros in Germany and 118 in the Netherlands, and in the Netherlands it is nothing at all until net metering ends in 2027, because until then every exported kilowatt-hour is credited at the full retail price, which is a free perfect battery. Sweden removed its 60 öre export credit on 1 January 2026, which is what makes home storage of any kind start to pay there.
The one thing that changes the picture is the car staying home. Run the same model for a household whose car is on the driveway all day, a retiree or someone who works from home, and the V2H increment roughly doubles, to 375 euros in Finland, 328 in France and 357 in Britain, and the solar case turns positive because the car is there at noon. This is the household V2H customer: not the commuter with the company car, who is the customer the public data sees, but the car that is parked.
| Market | Household bill, no battery | Smart charging saves | V2H adds, no solar | V2H adds, with solar | kWh cycled through the car | If the car never leaves home |
|---|---|---|---|---|---|---|
| Norway | 3 700 EUR | 100 EUR | 114 EUR | 107 EUR | 1 378 | 239 EUR |
| Sweden | 3 020 EUR | 122 EUR | 130 EUR | 126 EUR | 1 583 | 289 EUR |
| Finland | 2 989 EUR | 154 EUR | 164 EUR | 161 EUR | 1 639 | 375 EUR |
| Netherlands | 1 799 EUR | 126 EUR | 139 EUR | 118 EUR | 894 | 285 EUR |
| Germany | 1 788 EUR | 134 EUR | 150 EUR | 125 EUR | 856 | 245 EUR |
| France | 2 141 EUR | 112 EUR | 191 EUR | 172 EUR | 1 757 | 328 EUR |
| Italy | 1 276 EUR | 86 EUR | 44 EUR | 61 EUR | 451 | 72 EUR |
| Switzerland | 1 946 EUR | 129 EUR | 144 EUR | 125 EUR | 864 | 191 EUR |
| Spain | 846 EUR | 73 EUR | 115 EUR | 88 EUR | 1 076 | 179 EUR |
| Great Britain | 1 713 EUR | 509 EUR | 255 EUR | 188 EUR | 1 000 | 357 EUR |
| Greece | 990 EUR | 107 EUR | 145 EUR | 143 EUR | 1 258 | 280 EUR |
The car park: behind the meter, at scale
The other behind-the-meter case is the building, and it is a better one. An office, a hotel or a block of flats with a car park pays for electricity twice: per kilowatt-hour, and per kilowatt of its highest draw in the month. Elvia charges a business in Oslo 31 kroner per kW per month in summer and 74 in winter, about 55 euros per kW per year; a German distribution grid charges around 100 to 150 euros per kW per year in low voltage. That charge is set by one bad quarter-hour, usually the mid-afternoon in summer when the chillers are on and the cars are all still in the basement.
Fifty cars parked from nine to five, each willing to give back 5 kW for an hour, take 250 kW off that quarter-hour. In Germany that is worth 25 000 to 37 000 euros a year in capacity charges alone, or 500 to 750 euros per car, before any energy arbitrage or solar self-consumption; in Oslo about 14 000 euros, or 275 per car. The cars are present when the peak happens, which is the whole difference from the household case, and the building owner already has the meter, the fuse and the reason. On the charging side the same car park soaks up a rooftop’s midday surplus, which is ordinary smart charging and needs no bidirectional hardware at all.
The catches are the ones our public data can see. A workplace car park empties on Fridays, in July and at Christmas, exactly as the Swedish curves do, and the capacity charge is monthly, so one uncovered peak costs the month. The fleet owner also needs the drivers’ consent to take energy out of their cars, which is simple for pool vehicles and a contract for everyone else. Where the building owns the cars, this is the most bankable V2X case in Europe today.
Part 3. The demand side tomorrow: more volatility, less inertia
Two things are happening to the demand side at once, and they pull in different directions for a car. The first is that Europe is filling its grids with generation that cannot be scheduled. Wind capacity in the EU reached 246 GW at the end of 2025 and is headed for about 343 GW by 2030; solar passed 406 GW and the national plans add up to roughly 700 GW by 2030. Germany alone plans 215 GW of solar against 106 today, Spain 76 against 45, Italy 80 against 41. Solar produces at noon whether or not anyone wants it, so the cheap hours get cheaper, the shoulder hours get more expensive, and the gap between them, which is the whole of the behind-the-meter case, widens. The second is that a grid run on inverters has less spinning mass, so frequency moves faster after a fault and the system operator needs faster, not just more, response. That should be good for a battery on wheels. Whether it is depends on who else is offering the same thing.
The daily spread a car can capture: average gap between the four most expensive and four cheapest hours of each day, day-ahead, EUR per MWh, 2019 to 2026
Chargalytics from Energy-Charts day-ahead prices (bidding zones NO1, SE3, FI, NL, DE-LU, FR, IT-North, CH, ES, GR). For each day the mean of the four highest hourly prices minus the mean of the four lowest, averaged over the year. 2026 to end of August. This is the raw material of behind-the-meter arbitrage before tax, grid fee and VAT.
The spread is the measured part, and it has already moved. The chart takes each day's four most expensive hours against its four cheapest, in the day-ahead market, and averages over the year: from 2019 to 2025 the gap grew Norway 7.2×, Greece 5.8×, Spain 5.6×, Sweden 5.0×, Netherlands 4.7×, and 2026 so far is the widest year on record outside 2022 in seven of the ten zones. 2022 was the gas year and is an outlier everywhere; strip it out and the gap has widened every year since 2023 in every solar-heavy market: Germany and the Netherlands from about 80 euros to 100 in 2025 and near 130 in the first eight months of 2026, Spain from 63 to 103, France from 70 to 105, Greece from 95 to 136. Only Sweden and Finland are flat, held down by hydro and nuclear, and Norway's multiple starts from almost nothing. Negative prices are the same story from below: Germany had 69 hours below zero in 2022 and 573 in 2025, the Netherlands 584, Spain 556, Sweden’s SE2 681, and across the EU one hour in twenty-five was negative in 2024, one in sixteen in France, Germany, the Netherlands and Spain in 2025. ACER measures daily price swings at about five times their 2020 level, and Aurora projects German average hourly spreads rising a further third to 2030. The regulators have turned this into a requirement: the JRC puts the flexibility the EU system needs at 11% of demand today and 24% in 2030, ACER adopted the methodology for national flexibility-needs assessments in July 2025 and every member state must now publish one, and TenneT says the Netherlands needs 9 GW of grid batteries by 2030, and counts 2.2 GW of electric vehicles among the flexible capacity it expects.
| Share of hours below zero | 2019 | 2020 | 2021 | 2022 | 2023 | 2024 | 2025 | 2026 |
|---|---|---|---|---|---|---|---|---|
| Germany | 2.4% | 3.4% | 1.6% | 0.8% | 3.4% | 5.2% | 4.7% | 7.3% |
| Netherlands | 0.0% | 1.1% | 0.8% | 1.0% | 3.6% | 5.2% | 4.6% | 6.3% |
| France | 0.3% | 1.2% | 0.7% | 0.1% | 1.7% | 4.0% | 3.6% | 8.7% |
| Spain | 0.0% | 0.0% | 0.0% | 0.0% | 0.0% | 2.8% | 3.9% | 11.4% |
| Italy | 0.0% | 0.0% | 0.0% | 0.0% | 0.0% | 0.0% | 0.0% | 0.0% |
| Switzerland | 0.2% | 0.8% | 0.5% | 0.0% | 0.9% | 3.3% | 3.5% | 3.9% |
| Greece | 0.0% | 0.0% | 0.1% | 0.0% | 0.0% | 0.1% | 1.1% | 6.7% |
| Norway | 0.0% | 0.1% | 0.1% | 0.0% | 4.3% | 2.6% | 0.4% | 0.2% |
| Sweden | 0.0% | 0.1% | 0.1% | 0.3% | 4.9% | 7.4% | 3.3% | 1.1% |
| Finland | 0.0% | 0.1% | 0.1% | 0.3% | 5.3% | 8.2% | 3.9% | 0.7% |
So pool two, the arbitrage pool, grows with the fleet and with the spread, and it has no ceiling other than the household's own load. The price of that flexibility, though, is also being bid down, by the same batteries: Aurora expects more than 80 GW of grid-scale batteries in Europe by 2030 against 17 GW in 2025, Modo’s German forecast is 15.4 GW, and it was cut from 18.7 GW because of competition from electric vehicles. A battery in a container is a car without a driver: it arbitrages the same hours, in the same market, and each gigawatt of it flattens the spread the next car was going to earn.
Inertia is the part that sounds most like a job for cars and is least likely to become one. The physics are real. A study for the European Commission puts the Continental system’s inertia constant above five seconds in 2019 and below three by 2030, and finds that keeping the rate of change of frequency under 1 Hz per second after a split would need about 300 GW·s of additional inertia in 2030. ENTSO-E’s Project Inertia proposes a minimum inertia constant of two seconds half the time. The Nordic TSOs design their disturbance reserve for 150 GW·s of kinetic energy and report the hours below that level rising each year since 2022; Britain has cut its minimum-inertia floor from 140 to 120 GVA·s and proposes 102, saving a quarter of a billion pounds a year in constraint costs. But look at how the operators are buying the fix. Britain contracted 36 GVA·s of inertia through its Stability Pathfinders, almost all of it synchronous condensers, and adds only 200 MW of Dynamic Containment. Germany opened a market for instantaneous reserve in January 2026 at 805 to 889 euros per MW·s per year, with grid-forming inverters mandatory on high-voltage batteries since June. Svenska kraftnät buys 113 MW of fast frequency reserve and has 910 MW prequalified, and its 2035 need ranges from near zero to two and a half times today depending on how much nuclear stays. Inertia is being procured as an asset, a spinning mass or a grid-forming inverter tied to the transmission grid, not as a response a car can bid. What cars can bid, the sub-second and second products, are small and already eight times oversubscribed by batteries in Sweden. The frequency problem is real; the frequency market for cars does not get bigger because of it.
The pioneer's own path says the same thing. The Mobility House, founded in Munich in 2009 and backed by Mercedes-Benz, the Renault-Nissan alliance, Mitsui and Mercuria, prequalified a Nissan Leaf for primary reserve with Amprion in 2018 and said a car could earn 500 to 1 000 euros a year. Its commercial products since then have all been tariffs, not reserves: eyond in Germany, smart charging at a 10-cent discount worth about 400 euros a year; Mobilize Power in France, launched with Renault in October 2024, where the car earns about ten cents an hour plugged in and the household saves about 600 euros a year; free home charging in Germany from 2026 for a car on the cable 14 hours a day; and the pooling engine behind Volkswagen’s 720-euro offer. In February 2025 its managing director said the best markets are the deregulated ones with smart meters and that the Nordics, with their hydro, need it less; in August 2026 it sold its North American business and refocused on European V2G tariffs. The company that started in frequency reserve makes its money pooling cars into the wholesale and intraday market, behind a fixed-price promise to the driver. That is where the value went, and where the cars go next.
The forecasts agree on the direction and disagree on the size, mostly because they price different years. Fraunhofer for Transport & Environment finds up to 780 euros a year per household by 2040 in a fully optimised EU system; the VDE puts the practical figure at 200 to 300; Eurelectric and EY give 450 to 2 900 for 2030; the IEA reviewed the live offers and settled on several hundred dollars, typically about 500; Agora Verkehrswende’s German simulation finds arbitrage worth up to 500 and warns the result swings eight-fold between a 2021 and a 2022 price year; the BDL field trial with BMW and TenneT earned up to 75 euros a car in actual trading. The one British trial with reserve income, Sciurus, made 725 pounds a car in 2021 from Dynamic Containment at 64 pounds per kW; that product now pays under four.
| Study | Date | Method | EUR per car per year |
|---|---|---|---|
| Fraunhofer ISI/ISE for T&E, Batteries on wheels | Oct 2024 | EU system optimisation to 2040 | up to 780 (household saving) |
| Eurelectric / EY, Plugging into potential | Mar 2025 | Europe 2030, 50 million EVs | 450 to 2 900 (smart + bidirectional) |
| IEA, Vehicle-to-grid technology | May 2026 | Review of offers and studies | typically ~500, offers up to 770 |
| Agora Verkehrswende / RLI | Nov 2025 | German household simulation | arbitrage up to 500; V2H with PV 250 to 350 |
| VDE ETG | 2025 | Expert estimate | 200 to 300 |
| BDL project (FfE, BMW, TenneT) | Mar 2023 | Field trial | 75 trading; ~300 V2H |
| Cenex Sciurus (OVO, Nissan) | 2021 | UK trial, Dynamic Containment | £725 at 2021 prices |
| Live offers: Mobilize (FR), Elli, BMW/E.ON, TMH (DE) | 2024 to 2026 | Tariff terms | ~600 to 720 in year one |
| Chargalytics, this article | Sep 2026 | Hourly model on 2025/26 prices + reserve auctions | V2H 45 to 255; reserves 40 to 680 today, ~50 saturated |
Part 4. Supply meets demand: three scenarios to 2030
Take the supply from Part 1, the two pools from Part 2 and the forces from Part 3, and run them forward. Supply is the capable fleet on the cable at each country's grid peak in 2030 from our estimate, of which some share takes part, plus the grid batteries the forecasters expect. Demand is the reserve need, grown by a scenario factor, and the household load that can be moved, grown by the spread. Prices follow the rule the last five years taught: anchored on the 2025 auction result, falling by about 60% for each unit that zero-marginal-cost supply rises relative to need, with a floor of 4 euros per MW per hour, and recovering toward the pre-battery level if need outgrows supply. Three scenarios, spelled out in the table, bracket the uncertainty: one where the battery pipeline is built in full and the grid needs little more, one in the middle, and one where volatility and reserve need grow fast and the batteries are late.
| Scenario | Reserve need 2030 vs 2025 | Battery pipeline built | Capable cars taking part | Daily spread 2030 vs today | Aggregator share |
|---|---|---|---|---|---|
| Batteries win | ×1.1 | 100% | 10% | ×1.15 | 40% |
| Base | ×1.3 | 70% | 20% | ×1.35 | 40% |
| Volatile grid | ×1.8 | 50% | 30% | ×1.80 | 35% |
What one bidirectional car could net in 2030, reserves plus household arbitrage, EUR per year, three scenarios
Modelled. Reserves: 2025 pool × need growth; price anchored on the 2025 auction result and falling as batteries plus participating cars outgrow need, floor 4 EUR/MW/h; cars take their share, aggregator keeps 35–40%. Arbitrage: today’s V2H saving × spread growth. Scenario parameters and per-country results in the deep dive, Part 4.
The pattern is the same in all three. In the seven markets with a serious battery pipeline, Germany, Britain, France, the Netherlands, Spain, Italy and Greece, the reserve pool is at or near the floor by 2030 in the base case and a car's share of it is 6 to 23 euros a year. Only the volatile scenario, where need nearly doubles and half the batteries are not built, lifts it to 17 to 137. The pockets are Norway, Sweden, Switzerland and Finland, where batteries are few, capped or expensive to connect: there a car earns 137 to 419 in the base case and 317 to 609 if the grid gets volatile. Those numbers measure a regulatory moat, not a business: a Norwegian price that stays at 2025 levels because Statnett caps small batteries is a price that a change of rule, or a 300 MW container, removes. The arbitrage pool moves the other way: 154 to 344 euros a car outside Italy in the base case, rising with the spread in every scenario, and it is the only line that grows with the fleet instead of being divided by it.
Total value pools open to cars in eleven countries in 2030, million EUR per year
Reserve pool = need × price × 8760 h, all providers. Household arbitrage pool = V2H saving × cars participating. Same scenarios.
Add it up across the eleven countries and the reserve pool open to cars is worth 720 to 2332 million euros a year in 2030, of which cars would take 40 to 356 million, and the household arbitrage pool, at the participation rates assumed, 120 to 565 million. Against the 24 million electric cars our estimate puts on European roads by 2030, the reserve line is pocket money and the arbitrage line is a tariff discount. Against the 16 GW of capable inverters on the cable at the peak, though, both pools are worth having, because the plant costs nothing to build.
| Country | Batteries win: price EUR/MW/h | Batteries win: reserve pool MEUR | Batteries win: EUR/car reserves | Batteries win: EUR/car V2H | Base: price EUR/MW/h | Base: reserve pool MEUR | Base: EUR/car reserves | Base: EUR/car V2H | Volatile grid: price EUR/MW/h | Volatile grid: reserve pool MEUR | Volatile grid: EUR/car reserves | Volatile grid: EUR/car V2H |
|---|---|---|---|---|---|---|---|---|---|---|---|---|
| Germany | 4 | 100 | 9 | 172 | 4 | 118 | 14 | 202 | 4 | 164 | 26 | 270 |
| Great Britain | 4 | 93 | 12 | 293 | 4 | 109 | 16 | 344 | 16 | 608 | 98 | 459 |
| France | 4 | 66 | 15 | 220 | 4 | 83 | 23 | 258 | 15 | 391 | 137 | 344 |
| Netherlands | 4 | 19 | 4 | 160 | 4 | 23 | 6 | 188 | 16 | 127 | 40 | 250 |
| Norway | 10 | 93 | 344 | 131 | 10 | 114 | 419 | 154 | 10 | 165 | 609 | 205 |
| Spain | 4 | 35 | 10 | 132 | 4 | 41 | 16 | 155 | 4 | 57 | 29 | 207 |
| Italy | 4 | 39 | 5 | 51 | 4 | 46 | 9 | 59 | 4 | 63 | 17 | 79 |
| Sweden | 11 | 173 | 121 | 150 | 15 | 279 | 232 | 176 | 19 | 477 | 487 | 234 |
| Switzerland | 10 | 49 | 163 | 166 | 12 | 71 | 291 | 194 | 14 | 114 | 573 | 259 |
| Finland | 6 | 42 | 58 | 189 | 10 | 80 | 137 | 221 | 13 | 145 | 317 | 295 |
| Greece | 4 | 13 | 13 | 167 | 4 | 16 | 21 | 196 | 4 | 22 | 41 | 261 |
What it adds up to
Europe has one distributed battery and at least three timetables. In Amsterdam and Oslo it clocks in at 18:00 and sleeps on the street, which suits a summer evening peak and leaves Norway's winter record hour short. In Stockholm and Helsinki it works the day shift, which is when the summer grid peaks and not when the winter one does. In Zurich it is gone before the evening peak in any season. In Germany it is on the cable from mid-morning to late evening at 11 kW, with the largest capable fleet on the continent, which is why Germany abolished the double grid fee on fed-back electricity on 1 January 2026 and why its market opens first.
What the plant is worth is a smaller number than what it is, and the two curves that set it are moving in opposite directions. The supply curve, cars plus batteries, shifts right faster than any reserve need can grow, so the price of standing by heads for its floor everywhere the batteries are allowed in. The demand curve for moving energy through the day, set by solar and wind, shifts right too, and that pool is the one that survives: a saving on the bill, a few hundred euros a car, more where the car stays home and much more where a building's car park meets the building's peak. The distributed battery does not fail on technology or on timing. It has simply arrived at the end of the frequency curve and the beginning of the arbitrage one, and the money follows the second.
The rules are catching up with the cars. AFIR requires ISO 15118-20 on new public AC from 2027, the Nordic operators accept bids from 100 kW, Germany has removed its double fee, Spain has recognised the aggregator, Italy has started paying for frequency reserve. The plant will be there when they finish. Our data shows where it is parked and when; what this article adds is what the parking is worth, and to whom.
Sources
Rijksoverheid, salderingsregeling stopt in 2027
Skatteverket, mikroproduktion av förnybar el
Elvia, effekttariff lavspent næring, tariffblad 3.0, 1 January 2026
Westnetz, Preisblatt Netzentgelte Strom 2025
Nationaal Laadonderzoek 2025 (ElaadNL, RVO, VER)
VNA, Lease en elektrificatie 2025
OFV, new car sales and private leasing 2025
IEA Global EV Outlook 2026, charging chapter
Mobility Sweden, registrations 2025
Dataforce via electrive, German BEV registrations by channel 2025
Energy-Charts (Fraunhofer ISE), public power API, load, August 2026 and January 2026
Statnett, record consumption 7 January 2026
Geotab, EV range and temperature, 5.2 million trips
Kempton and Tomić, Vehicle-to-grid power fundamentals, Journal of Power Sources, 2005
Pike Research, nearly 100 000 vehicles V2G-enabled by 2017, November 2011
Nissan, LEAF to Home launch, May 2012
Navigant Research, vehicle-grid integration revenue forecast, March 2015
Nissan, Enel and Nuvve, first fully commercial V2G hub, Denmark, August 2016
UK government, £30 million for 21 V2G projects, February 2018
Navigant Research, VGI revenue forecast to 2030, December 2019
Hyundai and We Drive Solar, Utrecht bidirectional region, April 2022
AFIR delegated regulation 2025/656, ISO 15118 requirements
Automotive World, Elli BiDi charger 11 kW
BMW Group and E.ON, bidirectional charging for the iX3
Renault Group, Mobilize V2G and the Renault 5
Wallbox Quasar 2 specifications
Hyundai and Kia, V2X services in the Netherlands
NAF, single-phase versus three-phase charging in Norway
Volkswagen Group and Elli, vehicle-to-grid for the volume market
Electric Nation trial findings (UK)
Transport & Environment / Fraunhofer ISI and ISE, Batteries on wheels, 30 October 2024
Nuvve and Frederiksberg Forsyning, five years of continuous V2G operations
Fingrid, FCR technical requirements and prequalification, 1 September 2025
Virta, EV energy insights vol. 1
RTE, véhicules électriques et équilibrage du système électrique (Dreev FCR certification)
sun2wheel, V2X Suisse prequalified
Next Kraftwerke and Jedlix, electric vehicles in TenneT aFRR
Regelleistung.net, Leitfaden Präqualifikation bei Elektrofahrzeugen, September 2024
NESO and Octopus, Powerloop learnings, June 2023
El Periódico de la Energía, Real Decreto 88/2026 reconoce al agregador independiente
Pexapark, Italy prepares launch of FCR auction pilot, June 2026
ESS News, regulatory hurdles persist in Norway’s battery market, 3 September 2026
Svenska kraftnät, Mimer, primary regulation auction results
Emaldo, Swedish ancillary services market review, July 2026
Nordic TSOs, batteries in the Nordic reserve markets, April 2025
NESO data portal, Dynamic Containment auction results
Modo Energy, GB BESS buildout Q1 2026
Regelleistung.net, präqualifizierte Leistung in Deutschland, 1 January 2026
Modo Energy, Germany aFRR saturation, October 2025
Energy Pool, bilan marché énergie, November 2025 to January 2026
electrive, VW and Elli launch V2G offer with up to 720 euros annual bonus, 23 June 2026
Automobile Propre, Dreev explains its V2G offer, May 2019
Parker project final report, DTU, 2019
The Mobility House, German parliament removes double grid fees
Transport and Environment on the Electrification Action Plan, July 2026
WindEurope, Wind energy in Europe: 2025 statistics and outlook 2026–2030, February 2026
SolarPower Europe, EU Market Outlook 2025–2030, 11 December 2025
Bundesnetzagentur, SMARD electricity market 2025, 5 January 2026
pv magazine, Europe’s negative electricity price hours double in Q1, 8 May 2026
Ember, European Electricity Review 2026, January 2026
ACER, more flexibility and faster market integration needed, November 2025
Aurora Energy Research, RESMOR 2026
JRC, Flexibility requirements and the role of storage in future European power systems, 26 June 2023
ACER approves EU-wide methodology to assess national flexibility needs, 25 July 2025
Energy-Storage.News, Netherlands needs 9 GW of BESS by 2030 says TenneT
Modo Energy, Germany BESS forecast update, April 2026
ENTSO-E, Project Inertia Phase II position paper, 23 January 2025
Nordic TSOs, Requirements for minimum inertia in the Nordic power system, 28 August 2025
NESO, Frequency Risk and Control Report 2025
Modo Energy, Stability Pathfinders: inertia, short-circuit level and battery storage
Netztransparenz, market-based procurement of inertia (Momentanreserve), 2026
Svenska kraftnät, Balancing market outlook 2030, 2026 update, 9 June 2026
The Mobility House, VGI projects (Hagen FCR prequalification 2018)
The Mobility House, eyond and §14a EnWG, 19 December 2023
The Mobility House and Renault Mobilize, V2G in France, 22 October 2024
electrive, The Mobility House to offer free electricity for V2G customers, 15 April 2026
The Mobility House Energy, Elli and TMH Energy bring V2G to the volume market, June 2026
electrive, interview with Marcus Fendt, The Mobility House, 11 February 2025
electrive, The Mobility House sells North American business, 10 August 2026
VDE dialog, Bidirektional laden, 2025
Eurelectric and EY, Plugging into potential, March 2025
IEA, Vehicle-to-grid technology, 20 May 2026
Agora Verkehrswende / RLI, Bidirektionales Laden, November 2025
FfE et al., BDL project final report, 23 March 2023
Cenex, Project Sciurus trial insights, May 2021
KBA, electric passenger cars 1 January 2026
Eurostat, passenger cars in the EU
Statens vegvesen via Norsk elbilforening, fleet March 2026
English Housing Survey, parking and EV chargepoints
World Electric Vehicle Journal 17(6):305, Swedish EV owners without home charging
Transport and Environment, company car market report